Data Warehouse Center Administration Guide
Use statistical transformers to perform the following statistical
functions:
- Analysis of variance (ANOVA)
- Calculate basic statistics
- Calculate subtotals
- Chi-square test
- Chi-square goodness-of-fit test
- Correlation analysis
- Calculate moving averages
- Regression
Use the Analysis of Variance (ANOVA) transformer to produce statistical
calculations in two tables based on a small number of parameters. There
are three types of ANOVA: one-way ANOVA, two-way ANOVA, and three-way
ANOVA.
For more information about the ANOVA types, see the online help.
The ANOVA transformer obtains two independent estimates of variance.
The first estimate is based on variability between groups. The second
estimate is based on variability within groups. After the ANOVA
transformer computes these estimates, it calculates their ratio. A
family of distributions, the Fisher-F distributions, describes the
significance of this ratio.
This transformer also calculates a p-value. The p-value is the
probability that the means of the two groups are equal. A small p-value
leads to the conclusion that the means are different. For example, a
p-value of 0.02 means that there is a 2% chance that the sample means
are equal. Likewise, a large p-value leads to the conclusion that the
means of the two groups are not different.
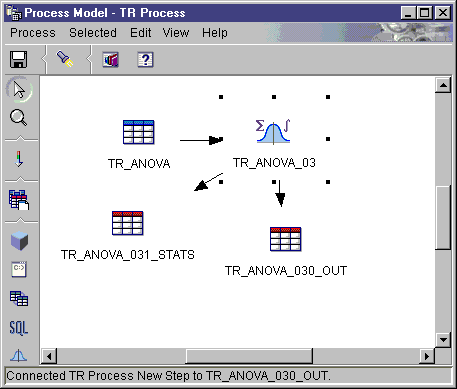
You can use this step only with tables that exist in the same
database. Use a warehouse source or target table as a source for the
ANOVA transformer and up to two warehouse target tables as targets for the
ANOVA statistical calculations. If you do not want to select a target
table for the ANOVA transformation, you can specify that the ANOVA transformer
creates tables on the target database. The Parameters page will not be
available for this step subtype until you link the step to a source in the
Process Model window.
Each time you run a step using this transformer, the existing data is
replaced. The ANOVA transformer drops the existing database table and
recreates it during each run.
You can make changes to the step only when the step is in development
mode.
To define an ANOVA transformer:
- Open the step notebook for the ANOVA transformer.
- Specify general information about the transformer. For more
information, see Providing general information about a step.
- On the Parameters page, select the column or columns from the
Available Columns field that will be the Grouping columns for the
ANOVA transformer. Depending on the type of ANOVA transformer that you
want to create, select one, two, or three columns, and click >
next to the Grouping columns field.
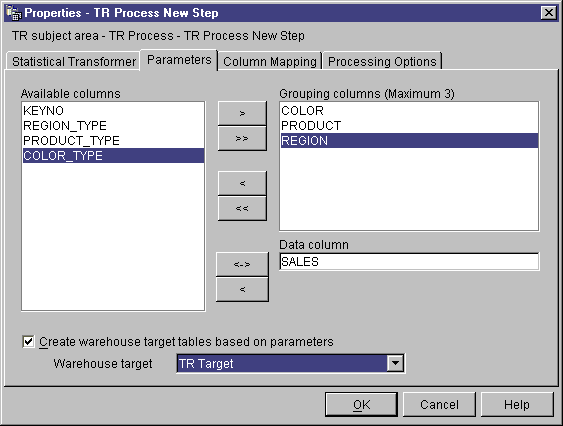
- From the Available Columns field, click a column name, and
click > next to the Data column field. This
column cannot be used as a grouping column. This column must contain
numeric data.
- Select target tables for your transformer:
- If your ANOVA transformer is using two target tables and is already linked
to the target tables, select one of the tables to contain ANOVA statistics
information. From the ANOVA statistics table list, select a
statistics target table for the ANOVA transformer.
- If your step is not already linked to a specific target table, select the
Create warehouse target table based on parameters check box to
create a target table based on the parameters you specify on this page.
If you select this check box, you must select a warehouse target from the
Warehouse target list.
- Optional: On the Column Mapping page, you can view the mappings
between the output columns that result from the transformations that you
defined on the Parameters page and the columns on your target table.
You cannot change these mappings. If the output table is not used by
any steps that are in test or production mode, you can rename target
columns. To rename a target column, double-click the column name and
type the new name.
- On the Processing Options page, provide information about how your step
processes. For more information, see Defining processing options.
- Click OK to save your changes and close the step
notebook.
Use the Calculate Statistics transformer to calculate the following
descriptive statistics on any number of data columns from a single
table:
- Count
- Sum
- Average
- Variance
- Standard deviation
- Standard error
- Minimum
- Maximum
- Range
- Coefficient of variation
To use the Calculate Statistics transformer, connect the step to a
warehouse source and a warehouse target that exist in the same
database. Or, you can connect the step to a warehouse source and
specify that the step create a target table for you in the same
database.
You can make changes to the step only when the step is in development
mode.
To define a Calculate Statistics transformer step:
- Open the step notebook for the Calculate statistics transformer.
- Specify general information about the transformer. For more
information, see Providing general information about a step.
- Click the Parameters tab.
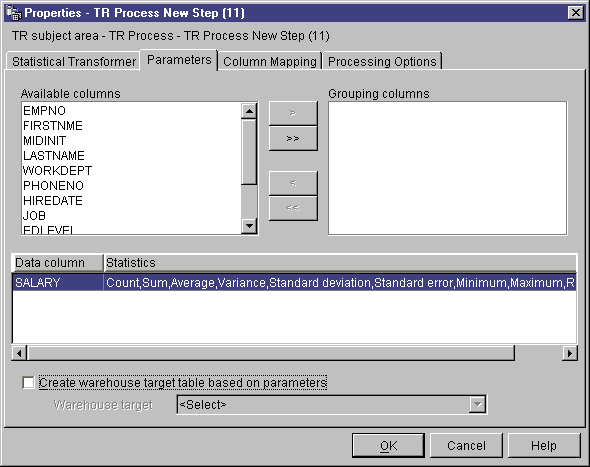
- Optional: From the Available columns list, select any
columns that you want to use as grouping columns, and click
>. Grouping columns can contain character or numeric
data.
- Define statistics calculations:
- Right-click anywhere on the Transformer definition table, and click
Add. A row is added to the table.
- Under the Data column heading in the row that you just created, click and
select a column for which to you want to calculate statistics.
- Double-click the Statistics field. The
... push button is available.
- Click the ... push button. The
Calculate Statistics - Select Statistics window opens.
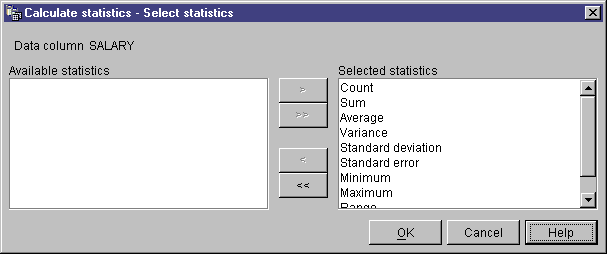
- From the Available statistics list, click one or more
statistics to run on the selected column. Then, click
>. The type of statistics that you can select from will
depend on the data type of the input column. For character data types,
only the Count function is available.
- Repeat steps 5a-e, as appropriate.
- Click OK. The Elementary Statistics - Select Statistics
window closes.
After you define a statistics calculation, it cannot be changed. You
must delete unwanted definitions and redefine them. The Calculate
Statistics transformer supports partial data. For example, if you
select a column to define statistics for, but you don't select the
statistics for it, the Calculate Statistics transformer will save your column
selection. However, you cannot map columns for a row that has a partial
data selection, nor can you successfully run a step that has a partial data
selection.
- On the Column Mapping page, map the output columns that result from your
statistical calculations to columns in your target table. The column
names for your statistical calculations are based on the data column that you
select on the Parameters page and the statistic that you select for it.
A column is created for each statistic that is selected for a data
column. For example, if your data column, Sales, has the statistics
"Sum" and "Average" defined to it, the columns Sales_sum and Sales_average
will be displayed on the Column Mappings page.
Output columns are listed on the left side of the page, under the heading
Source Columns. Target columns from the output table linked
to the step are listed on the right side of the page.
Use the Column Mapping page to perform the following tasks:
- To create a mapping, click a source column and drag it to a target
column. An arrow is drawn between the source column and the target
column.
- To delete a mapping, right-click an arrow, and click
Delete. If the output table is not used by any steps that
are in test or production mode, you can change the attributes of the target
column.
- To rename a target column, double-click the column name and type the new
name. You can also change any other attributes of the target column by
double-clicking the attribute.
If the Parameters page produces no output columns, or if this step is not
linked to a target table and you have not specified automatic generation of a
default table in the Parameters page, you will not be able to use this page to
map your columns. Some steps will not allow you to change the column
mapping.
- On the Processing Options page, provide information about how your step
processes. For more information, see Defining processing options.
- Click OK to save your changes and close the step
notebook.
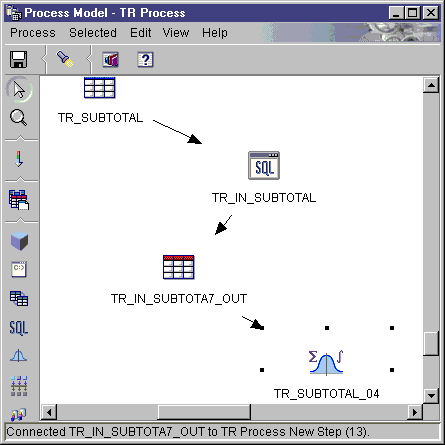
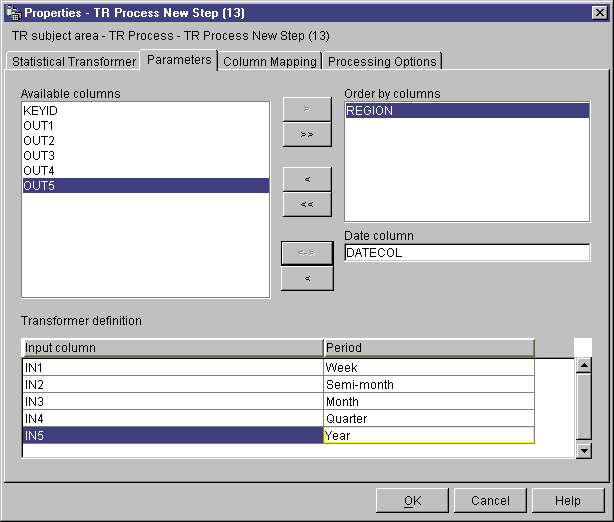
Use the Calculate subtotals transformer to calculate the running subtotal
for a set of numeric values grouped by a period of time, either weekly,
semimonthly, monthly, quarterly, or annually. For example, for
accounting purposes, it is often necessary to produce subtotals of numeric
values for basic periods of time. This is most frequently encountered
in payroll calculations where companies are required to produce month-to-date
and year-to-date subtotals for various types of payroll data.
The Calculate Subtotals transformer uses a warehouse target table as a
source. The table that you use as a source must contain a primary
key. The transformer writes to a table on the same database.
Before you define this step, link the warehouse target to the step in the
Process Model window, with the arrow pointing towards the step. The
Parameters page will not be available for this step subtype until you link it
to a source in the Process Model window. You can make changes to the
step only when the step is in development mode.
To define a Calculate Subtotals transformer:
- Open the step notebook for the Calculate subtotals transformer.
- Specify general information about the transformer. For more
information, see Providing general information about a step.
- Click the Parameters tab.
- Optional: Click columns from the Available columns list
to order the output data. Then, click > next to the
Order by columns list.
- From the Available columns list, click the date column in the
input table. The column data type must be DATE or TIMESTAMP.
Then, click > next to the Date column field.
- Define a subtotal calculation:
- Right-click anywhere on the Transformer definition table, and click
Add. A row is added to the table.
- Under the Input column heading in the row you just added,
left-click and select the name of the column on which to calculate a
subtotal. Only available numeric columns are listed. A numeric
column is not listed if it is being written to by another row or if it is
selected as a grouping column. If you use a column as an input in two
or more rows, you cannot use the column as an output column.
- Under the Period column heading, left-click and select the
period for which to calculate.
- Repeat steps 6a-c to define additional subtotal calculations.
- Use the Column Mapping page to map output columns from your transformer to
columns on your target table.
Columns that result from your transformation are listed on the left side of
the page, under the heading Source Columns. These columns are named
after the selections you made for the Input column and the Period column on
the Parameters page. For example, if you selected SALARY as the input
column and Month for the period on the Parameters page, you will see
"SALARY_Month" displayed on the left side of the Column Mapping page.
Columns in your target table are listed on the right side of the page.
Restrictions:
The following restrictions apply to a single instance of a step. For
example, you have step 1 and step 2. In step 1, you can use column B as
a source column. In step 2, you can use column B as a target
column.
- Because the calculate subtotal transformer can write to its source column,
you can map an input column to itself. For example, you can map source
column A to itself:
| Source column
| Target column
|
| A
| A
|
You can map a column to itself only if the column is not used as an input
column in another transformer definition row. For example, you cannot
map column A to itself if the following is true:
| Source column
| Target column
|
| A_week
|
|
| A_month
|
|
In this example, column A is used as an input column in two separate
transformer definitions.
- You cannot use a source column that is mapped to a target column as a
target column in another mapping in the same step definition. For
example, you have the columns B, C and D. Your first row is specified
as follows:
| Source column
| Target column
|
| B
| C
|
Because column B is mapped as a source column, the following mapping is
not allowed:
| Source column
| Target column
|
| D
| B
|
- After a column is mapped as a target, you cannot use the column as either
an input column or a target output column in any other mappings in this step
definition. For example, you have the following rows:
| Source column
| Target column
|
| A
| A
|
| B
| C
|
Because you specified Column A and Column C as output columns, you cannot
use them as either input columns or output columns in any additional
rows.
Use the Column Mapping page to perform the following tasks:
- To create a mapping, click a source column and drag it to a target
column. An arrow is drawn between the source column and the target
column.
- To delete a mapping, right-click an arrow and click
Delete. If the output table is not used by any steps that
are in test or production mode, you can change the attributes of the target
column.
- To rename a target column, double-click the column name and type the new
name. You can also change any other attributes of the target column by
double-clicking the attribute.
If the Parameters page produces no output columns, or if this step is not
linked to a target table and you have not specified automatic generation of a
default table in the Parameters page, you will not be able to use this page to
map your columns. Some steps will not allow you to change the column
mapping.
- On the Processing Options page, provide information about how your step
processes. For more information, see Defining processing options.
- Click OK to save your changes and close the step
notebook.
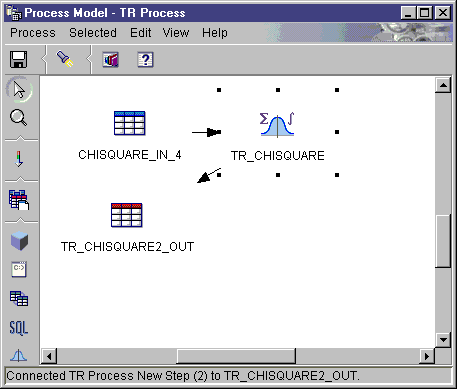
Use the Chi-Square transformer to perform the chi-square test and the
chi-square goodness-of-fit test on columns of numerical data. These
tests are nonparametric tests.
You can use the statistical results of these tests to make the following
determinations:
- Whether the values of one variable are related to the values of another
variable
- Whether the values of one variable are independent of the values of
another variable
- Whether the distribution of variable values meets your expectations
Use these tests with small sample sizes or when the variables that you are
considering might not be normally distributed. Both the chi-square test
and the chi-square goodness-of-fit test make the best use of data that cannot
be precisely measured.
The Chi-square transformer optionally produces an additional output table
called the Expected value output table. You can select a table to be
used as the Expected value output table, or you can specify that the table
will not be produced.
When you set up this process in the Process Model window, link the
Chi-Square step to a warehouse target table. If you want the step to
produce the Expected value output table, link the step to a second warehouse
target table in the same database.
You can change the step definition only when the step is in development
mode.
To define a Chi-square transformer:
- Open the step notebook.
- Specify general information about the transformer. For more
information, see Providing general information about a step.
- In the Available columns list on the Parameters page, click a
column. Then, click > next to the Column of row
definition field. This field is required for both goodness-of-fit
calculation and chi-square calculations. If you want your step to run
as a chi-square calculation, go to step 4. Otherwise, go to step
5. Your step will run as a goodness-of-fit calculation.
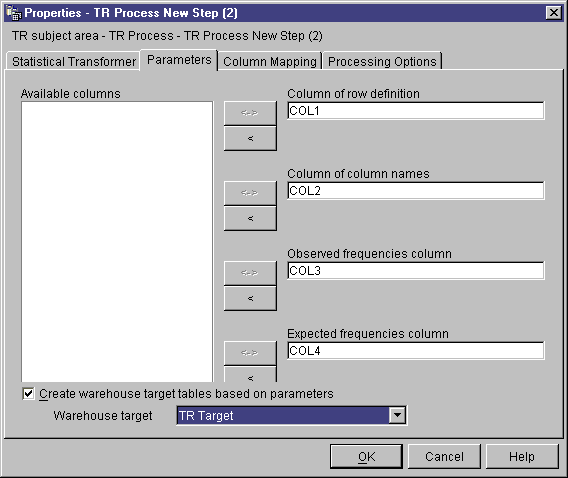
- To define a chi-square calculation, click a column in the Available
columns list, and click > next to the Column of column
names field.
- In the Available columns list, click a column that contains the
observed frequencies data. This column must be of numeric type.
Then, click > next to the Observed frequencies column
field.
- In the Available columns list, click a column that contains
expected frequency data. This column must be of numeric type.
Then, click > next to the Expected frequencies column
field. This field is required for goodness-of-fit calculations and
optional for chi-square calculations. If you specify an expected
frequencies column, you cannot use the expected values output table.
- In the Expected values output table list, select a target table
for the expected values output table. Depending on certain conditions,
this field is either optional or required:
- This field is optional if only one target table is linked to the
chi-square step in the Process Model window. If you want to create an
expected values output table, select your target table. Then, click
OK to save and close the step. Next, in the Process Model
window, link a second table to the chi-square step to contain your regular
chi-square output. Finally, open the chi-square step and continue
defining values for the transformer.
- This field is optional for chi-square calculations.
- This field is required if two tables are linked to the chi-square step in
the Process Model window. Select one of the tables to be the expected
values output table.
- Optional: On the Column Mapping page, you can view the mappings
between the output columns that result from the transformations that you
defined on the Parameters page and the columns on your target table.
You cannot change these mappings. If the output table is not used by
any steps that are in test or production mode, you can rename target
columns. To rename a target column, double-click the column name and
type the new name.
- On the Processing Options page, provide information about how your step
processes. For more information, see Defining processing options.
- Click OK to save your changes and close the step
notebook.
Use the Correlation transformer to determine the extent to which changes in
the value of an attribute (such as length of employment) are associated with
changes in another attribute (such as salary). The data for a
correlation analysis consists of two input columns. Each column
contains values for one of the attributes of interest. The Correlation
transformer can calculate various measures of association between the two
input columns. You can select more than one statistic to calculate for
a given pair of input columns.
The data in the input columns also can be treated as a sample obtained from
a larger population, and the Correlation transformer can be used to test
whether the attributes are correlated in the population. In this
context, the null hypothesis asserts that the two attributes are
not correlated, and the alternative hypothesis asserts that the
attributes are correlated.
The Correlation transformer calculates any of the following
correlation-related statistics on one or more pairs of columns:
- Correlation coefficient r
- The correlation coefficient r is a measure of the linear
relationship between two attributes or columns of data. The correlation
coefficient is also known as the Pearson product-moment correlation
coefficient. The value of r can range from -1 to +1 and is
independent of the units of measurement. A value of r near 0
indicates little correlation between attributes; a value near +1 or -1
indicates a high level of correlation.
When two attributes have a positive correlation coefficient, an increase in
the value of one attribute indicates a likely increase in the value of the
second attribute. A correlation coefficient of less than 0 indicates a
negative correlation. That is, when one attribute shows an increase in
value, the other attribute tends to show a decrease.
Consider two variables x and y:
- If r = 1, then x and y are perfectly positively
correlated. The possible values of x and y all lie on
a straight line with a positive slope in the (x,y) plane.
- If r = 0, then x and y are not correlated. They
do not have an apparent linear relationship. However, this does not
mean that x and y are statistically independent.
- If r = -1, then x and y are perfectly negatively
correlated. The possible values of x and y all lie on
a straight line with a negative slope in the (x,y) plane.
- Covariance
- Covariance is a measure of the linear relationship between two attributes
or columns of data. The value of the covariance can range from
-infinity to +infinity. However, if the value of the covariance
is too small or too large to be represented by a number, the value is
represented by NULL.
Unlike the correlation coefficient, the covariance is dependent on the
units of measurement. For example, measuring values of two attributes
in inches rather than feet increases the covariance by a factor of 144.
- T-value
- T-value is the observed value of the T-statistic that is used to test the
hypothesis that two attributes are correlated. The T-value can range
between -infinity and +infinity. A T-value near 0 is evidence for
the null hypothesis that there is no correlation between the
attributes. A T-value far from 0 (either positive or negative) is
evidence for the alternative hypothesis that there is correlation between the
attributes.
The definition of T-statistic is:
T = r * SQRT((n-2) / (1 - r*r))
where r is the correlation coefficient, n is the number
of input value pairs, and SQRT is the square root function.
If the correlation coefficient r is either -1 or +1, the T-value
is represented by NULL. If the T-value is too small or too large to be
represented by a number, the value is represented by NULL.
- P-value
- P-value is the probability, when the null hypothesis is true, that the
absolute value of the T-statistic would equal or exceed the observed value
(T-value). A small P-value is evidence that the null hypothesis is
false and the attributes are, in fact, correlated.
Your source table and target table must exist in the warehouse
database. This transformer can create a target table in the same
warehouse database that contains the source, if you want it to. You can
change the step only when the step is in development mode.
To define a Correlation transformer step:
- Open the step notebook.
- Specify general information about the transformer. For more
information, see Providing general information about a step.
- Click the Parameters tab.
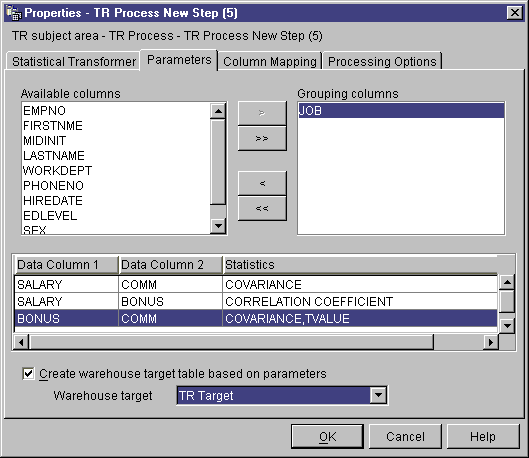
- Optional: Click columns that you want to use as grouping columns and
click >. Grouping columns can contain character or
numeric data.
- Define correlation statistics:
- Right-click anywhere on the Transformer definition table, and click
Add. A row is added to the table.
- Under the Data Column 1 heading in the row that you just added,
click and select the first column for the calculation. Only columns of
numeric type are listed.
- Under the Data Column 2 heading, click and select the second
column for the calculation. Only columns of numeric type are
listed. You cannot use the same column in Data Column 2 that you use in
Data Column 1.
- Double-click under the Statistics heading in the row you just
created. The ... push button is
available.
- Click the ... push button. The
Correlation - Select Statistics window opens.
- Click one or more statistics from the Available statistics
list. Then, click >. The statistics are moved to
the Selected statistics list.
- Repeat steps 5a-f, as appropriate.
- Click OK. The Correlation - Select Statistics window
closes.
The Correlation transformer supports partial data. For example, if
you select a column to define statistics for, but don't select the
statistics for it, the Correlation transformer will save your column
selection. However, you cannot map columns for a row that has a partial
data selection, nor can you successfully run a step that has a partial data
selection.
- On the Column Mapping page, map the columns that result from your
correlation statistics to columns in your target table.
The column names for your correlation statistics are based on the data
column entries that you select on the Parameters page and the statistic that
you select for it. A column is created for each statistic that is
selected and its corresponding data columns. For example, if your data
columns, Salary and Employment, have the correlation statistics Covariance and
T-value defined to them, the columns Covariance_Salary_Employment and
T-value_Salary_Employment will be displayed on the Column Mappings
page. Output columns are listed on the left side of the page, under the
heading Source Columns. Target columns from the output table
linked to the step are listed on the right side of the page. Use the
Column Mapping page to perform the following tasks:
- To create a mapping, click a source column and drag it to a target
column. An arrow is drawn between the source column and the target
column.
- To delete a mapping, right-click an arrow, and click
Delete. If the output table is not used by any steps that
are in test or production mode, you can change the attributes of the target
column.
- To rename a target column, double-click the column name and type the new
name. You can also change any other attributes of the target column by
double-clicking the attribute.
If the target column is mapped to a source column, the mapping remains
intact. If the Parameters page produces no output columns, or if this
step is not linked to a target table and you have not specified automatic
generation of a default table in the Parameters page, you will not be able to
use this page to map your columns. Some steps will not allow you to
change the column mapping.
- On the Processing Options page, provide information about how your step
processes. For more information, see Defining processing options.
- Click OK to save your changes and close the step
notebook.
Simple and exponentially smoothed moving averages can often predict the
future course of a time-related series of values. Moving averages are
widely used in time-series analysis in business and financial
forecasting. Rolling sums have other widely used financial uses.
You can use the Moving Average transformer to calculate the following
values:
- A simple moving average
- An exponential moving average
- A rolling sum for N periods of data, where N is specified by the user
An exponential moving average is also known as an exponentially smoothed
moving average.
Moving averages redistribute events that occur briefly over a wider period
of time. This redistribution serves to remove noise, random
occurrences, large peaks, and valleys from time-series data. You can
apply the moving average method to a time-series data set to:
- Remove the effects of seasonal variations.
- Extract the data trend.
- Enhance the long-term cycles.
- Smooth a data set before performing higher-level analysis.
The Moving Average transformer uses a warehouse target table as a
source. The table that you use as a source must contain a primary
key. The transformer writes to a table on the warehouse target.
Before you define this step, link the warehouse target to the step in the
Process Model window, with the arrow pointing towards the step.
To define a Moving Average transformer:
- Open the step notebook.
- Specify general information about the transformer. For more
information, see Providing general information about a step.
- On the Parameters page, in the Available Columns field, click
columns that you want to use as grouping columns, then click
>. The columns are moved to the Order by
columns field. Grouping columns can contain character or numeric
data.
- For each column listed in the Order by columns field, click a
sort order from the Sort list. Select Ascending
for ascending order. Select Descending for descending
order.
- Define moving average calculations:
- Right-click anywhere on the Transformer definition table, and click
Add. A row is added to the table.
- Under the Input column heading in the row that you just added, left-click
and select a column for which to calculate a moving average. Only
numeric columns are listed. A numeric column is not listed if it is
being written to by another row, or if it is selected as a grouping
column. If you use a column as an input in 2 or more rows, you cannot
use the column as an output column.
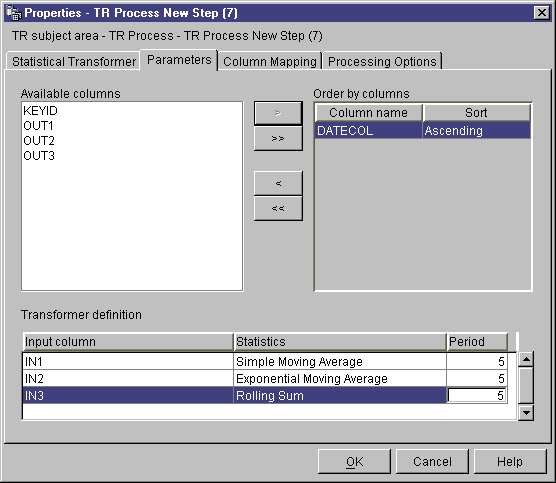
- Under the Statistics column heading, left-click and select the
type of moving average to calculate.
In the Moving Average transformer, you can select one of three
statistics:
- A simple moving average. A simple moving average (SMA) is defined
as:
SMA [row i] = SUM (data values for last N rows) / N
- An exponential moving average. An exponential moving average (EMA)
is defined as:
EMA [row i] = ( Value [row i] * K ) + ( EMA [row i-1] * ( 1-K ) )
where: K = 2/(N+1)
For example: For a four-day EMA, N = 4, K = 2/5 and 1-K = 3/5.
An exponential moving average is also known as an exponentially smoothed
moving average.
- A rolling sum for N periods of data, where N is specified by the
user. A rolling sum (RS) is defined as:
RS [row i] = SUM ( data values for the last N rows)
- Under the Period column heading, double-click the field, then
type the number of days for which the moving average will be
calculated. For example, if you want to calculate the moving average
for one week, type 7. You can only type digits. Other
keystrokes are ignored.
- Repeat steps 5a-d, as appropriate.
- On the Column Mapping page, map output columns from your transformer to
columns on your target table.
Columns that result from your transformation are listed on the left side of
the page. These columns are named after the selections you made for the
Input column, the Statistics column, and the Period column on the Parameters
page. For example, if you selected SALARY as the input column, EMA as
the calculation, and 7 for the period on the Parameters page, you will see
SALARY_EMA_7 displayed on the left side of the Column Mapping page .
Restrictions:
These restrictions apply to a single instance of a step. For
example, you have step 1 and step 2. In step 1, you can use column B as
a source column. In step 2, you can use column B as a target
column.
- Because the moving average transformer can write to its source column, you
can map an input column to itself. For example, you can map source
column A to itself:
| Source column
| Target column
|
| A
| A
|
You can map a column to itself only if the column is not used as an input
column in another transformer definition row. For example, you cannot
map column A to itself if the following is true:
| Source column
| Target column
|
| A_EMA_7
|
|
| A_EMA_31
|
|
In this example, column A is used as an input column in two separate
transformer definitions.
- You cannot use a source column that is mapped to a target column as a
target column in another mapping in the same step definition. For
example, you have the columns B, C and D. Your first row is specified
as follows:
| Source column
| Target column
|
| B
| C
|
Because column B is mapped as a source column, the following mapping is
not allowed:
| Source column
| Target column
|
| D
| B
|
- After a column is mapped as a target, you cannot use the column as either
an input column or a target output column in any other mappings in this step
definition. For example, you have the following rows:
| Source column
| Target column
|
| A
| A
|
| B
| C
|
Because you specified Column A and Column C as output columns, you cannot
use them as either input columns or output columns in any additional
rows.
Use the Column Mapping page to perform the following tasks:
- To create a mapping, click a source column and drag it to a target
column. An arrow is drawn between the source column and the target
column.
- To delete a mapping, right-click an arrow, and click
Delete. If the output table is not used by any steps that
are in test or production mode, you can change the attributes of the target
column.
- To rename a target column, double-click the column name, and type the new
name. You can also modify any other attributes of the target column by
double-clicking the attribute.
If the Parameters page produces no output columns, or if this step is not
linked to a target table and you have not specified automatic generation of a
default table in the Parameters page, you will not be able to use this page to
map your columns. Some steps will not allow you to change the column
mapping.
- On the Processing Options page, provide information about how your step
processes. For more information, see Defining processing options.
- Click OK to save your changes and close the step
notebook.
Use the Regression transformer to identify the relationships between a
dependent variable and one or more independent variables, and to show how
closely they are correlated. You can use this transformer to show the
effect of a change in pricing on demand for a product, to show the effect of
location on the response to advertising, or to show how closely two seemingly
random sets of data are related.
This transformer performs a backward, full-model regression. This
method starts with all independent variables in a model, but removes the
least-important independent variables one at a time until only significant
independent variables remain in the model.
The Regression transformer produces two additional output tables: the
ANOVA summary table and the Equation variable table.
Before you begin this task, you must link this step in the Process Model
window to a warehouse source table and three warehouse target tables.
Or, you can link the step to a source and specify that the step create the
target tables. The tables must exist in the same database. The
Regression transformer writes the results from the Regression transformation
to a table on one warehouse target, and creates the ANOVA summary table and
the Equation variable table on the second and third targets. You can
make changes to the step only when the step is in development mode.
To define a Regression transformer:
- Open the step notebook.
- Specify general information about the transformer. For more
information, see Providing general information about a step.
- On the Parameters page, select columns from the Available
columns list that contain independent variable data used for prediction
in the regression calculations. Then, click > next to the
Predictor columns list. The columns are added to the
Predictor columns list. Only columns of numeric data type
are available.
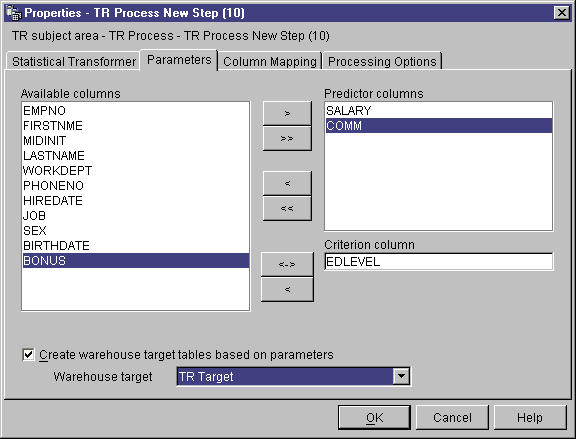
- From the Available columns list, click one column that contains
the dependent variable data to use for criteria in the regression
calculations. Then, click > next to the Criterion
column field. Only columns of numeric data type are
available.
- In the Summary table list, select a target table to be your
ANOVA summary table.
- In the Equation variable table list, select a target table to
be your Equation variable table.
- Optional: On the Column Mapping page, you can view the mappings
between the output columns that result from the transformations that you
defined on the Parameters page and the columns on your target table.
You cannot change these mappings. If the output table is not used by
any steps that are in test or production mode, you can rename target
columns. To rename a target column, double-click the column name and
type the new name.
- On the Processing Options page, provide information about how your step
processes. For more information, see Defining processing options.
- Click OK to save your changes and close the step
notebook.
[ Top of Page | Previous Page | Next Page ]