
This chapter describes the reports available in Tracker including: the Total Table Hits report and the drill-down reports beneath it, the Rows Returned by Table report, and the Job Activity over Time report.
The Tracker query utility allows you to display database usage history information through predefined reports. These reports provide you with job history information from DB2 Query Patroller if DB2 Query Patroller has been set up to collect job accounting information.
When you enter the Tracker application, you choose an initial report for Tracker to display. You can choose to display the following reports:
After a report displays, you can drill down to display more specific
information if additional reports are available. The reports and drill
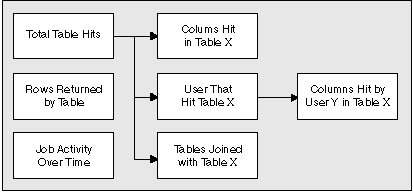
paths you can choose are shown in the following diagram:

The Total Table Hits report and the Rows Hit by Table report display count or percentage information that can be formatted as bar charts, lists, or pie charts. As you drill down through subsequent reports, each report displays in the same format (bar chart, pie chart, or list), until you change the current report format. The Job Activity over Time report displays time information and a list of completed jobs. It can only be displayed as a time chart.
When you display data as a count, the data is an integer. For example, when calculating the tables hit, Tracker counts the number of times each table is accessed.
When you display data as a percentage, the data displayed is a percentage of the total count for all the elements that have been accessed. If a similar element is not accessed, it is not included in the percentage calculation. For example, when calculating the percentage for table hits, Tracker counts all the hits for all tables. The percentage for a particular table is the number of hits for that table divided by the total number of hits multiplied by 100%.
The Total Table Hits report displays the number of times each table has been accessed (or hit) by queries submitted against the database within the defined date range. Alternatively, the report shows the percentage of hits per table relative to the total number of hits on all tables.
| Note: | Even though the hours do not display in the date range at the left side of this and other reports, the hours can be specified and are used to determine the date range for the information in the report. |
From the Total Table Hits Report, you can drill down to get the following reports:
The Columns Hit in Table X report lists each column in a specific table and the number of times the column has been accessed by queries within the defined date range. Alternatively, the report shows the percentage of hits per column relative to all columns in the table.
The Users That Hit Table X report lists the ID of each user accessing a specific table and the number of times the table is accessed by that user within the defined date range. Alternatively, the report shows the percentage for each user who accessed a table relative to all users who accessed the table. From this report, you can drill down to the columns hit in that table by a specific user.
The Columns Hit by User Y Hitting Table X report lists the columns accessed by a specific user for a specific table and the number of times those columns were accessed within the defined date range. Alternatively, the report shows the percentage each column was accessed by a specific user relative to the total accesses to all columns in that table by that user.
The Tables Joined with Table X report lists the tables joined with the original table through a query and the number of times a join occurred within the defined date range. Alternatively, the report shows tables joined with the original table and the percentage the joins represent relative to the total number of accesses to the original table.
The Rows Returned by Table report lists the name of each table accessed and the number of rows returned for all queries submitted against the table within the defined date range. Alternatively, the report shows the number of rows returned from each table as a percentage of the total number of rows returned from all tables.
The Job Activity over Time report displays the following information:
The Job Activity over Time report displays all the jobs that were completed between the defined start and end dates. The graph at the top of the report summarizes the data for the completed jobs. The scroll list at the bottom of the report provides details on each job. The job submit time, job start time, and job end time are displayed graphically and in the detailed job list, which also provides the job ID, user ID, and account ID.
The job list shows jobs sorted by job elapsed time, so that you can easily identify the jobs that are taking a long time to complete. The graph displays lead time in yellow and run time in red.
For additional job detail information, such as execution cost, the number of result rows, result set destination, and the SQL statement, double-click on a specific job in the scroll list to open the Job Detail Information window.