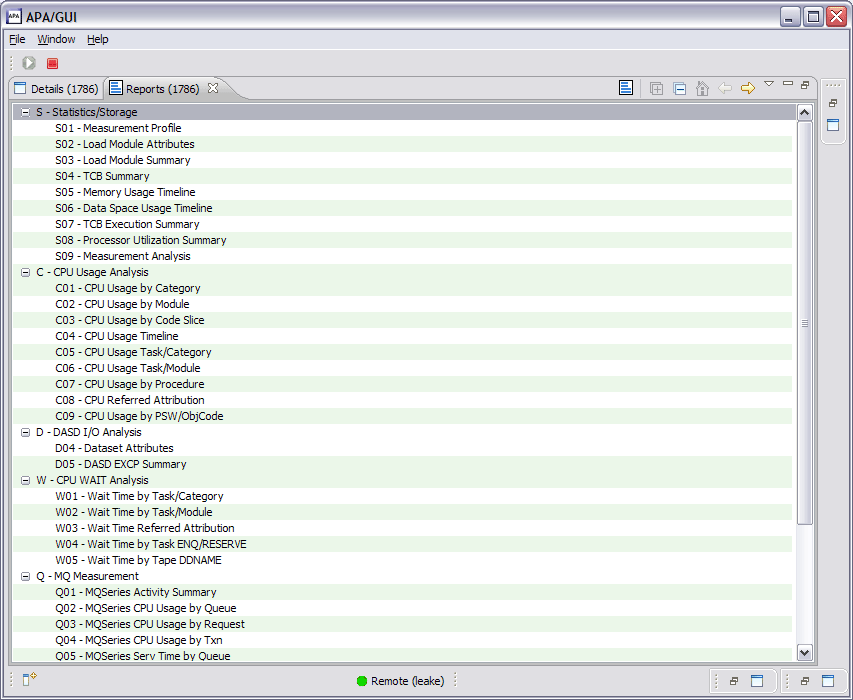
Observation Reports List view

The reports list is a 2-level tree-view. The first level (parent) rows represent the report category while the second-level (child) rows are for the individual reports. Not all categories and reports are listed in the Reports List view, only those that exist for the selected observation. The list is opened to the category set for the Expand Default user preference.
The category rows are for informational/organizational purposes only and result in no action if clicked (other than if the category is expanded). For each report row that is selected, a new Report View is opened and the Report Options view is updated to the active (selected) report. Refer to Report views for details.
A context menu is available for each row on the report list. Right-click the row of the desired report or category and the list of available menu actions is displayed. Refer to Context menu for details.
Refer to Performance analysis reports through WebSphere performance analysis reports for details of the individual reports.