|
|
|
|
Using Rational Purify
Rational Purify: What it does
Rational® Purify® is the most comprehensive run-time error detection tool available. It checks all the code in your program, including any application, system, and third-party libraries. Purify works with complex software applications, including multi-threaded and multi-process applications.
Purify checks every memory access operation, pinpointing where errors occur and providing detailed diagnostic information to help you analyze why the errors occur. Among the many errors that Purify helps you locate and understand are:
- Reading or writing beyond the bounds of an array
- Using uninitialized memory
- Reading or writing freed memory
- Reading or writing beyond the stack pointer
- Reading or writing through null pointers
- Leaking memory and file descriptors
With Purify, you can develop clean code from the start, rather than spending valuable time debugging problem code later.
This chapter introduces the basic concepts involved in using Purify. For complete information, see the Purify online help system.
Finding errors in Hello World
This chapter shows you how to use Purify to find memory errors in an example Hello World program. If you run the example yourself, you should expect minor platform-related differences in program output from what is shown here.
- Create a new working directory. Go to the new directory and copy the hello_world.c program and related files from the <purifyhome>/example directory. For example:
% mkdir /usr/home/chris/pwork % cd /usr/home/chris/pwork % cp <purifyhome>/example/hello*- Examine the code in hello_world.c. The version of hello_world.c provided with Purify is slightly different from the traditional version.
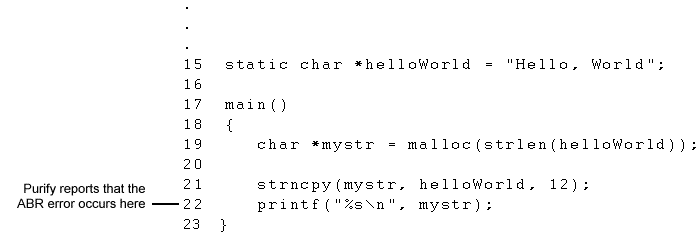
 1  /*
 2   * Copyright (c) 1992-1997 Rational Software Corp.
     ...
 9   * This is a test program used in Purifying Hello World
10   */
11
12  #include <stdio.h>
13  #include <malloc.h>
14
15  static char *helloWorld = "Hello, World";
16
17  main()
18  {
19     char *mystr = malloc(strlen(helloWorld));
20
21     strncpy(mystr, helloWorld, 12);
22     printf("%s\n", mystr);
23  }
At first glance there are no obvious errors, yet the program actually contains a memory access error and leaked memory that Purify will help you to identify.Instrumenting a program
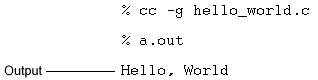
- Compile and link the Hello World program, then run the program to verify that it produces the expected output:
- Instrument the program by adding purify to the front of the compile/link command line. To get the maximum amount of detail in Purify messages, use the -g option:
% purify cc -g hello_world.cNote: On IRIX, you can add purify in front of the compile/link command line, or you can Purify the executable:% purify a.outOn IRIX, Purify caches Dynamic Shared Objects (DSOs), not object files. Ignore all references to linkers and link-line options in this book. These do not apply to Purify on IRIX.Compiling and linking in separate stages
If you compile and link your program in separate stages, specify purify only on the link line. For example:% cc -c -g hello_world.cOn the link line, use:% purify cc -g hello_world.oRunning the instrumented program
Run the instrumented Hello World program:% a.outOn IRIX, if you use purify on the executable instead of on the compile/link line, type:% a.out.pureThis prints "Hello, World" in the current window and displays the Purify Viewer.
Notice that the instrumented Hello World program starts, runs, and exits normally. Purify does not stop the program when it finds an error.
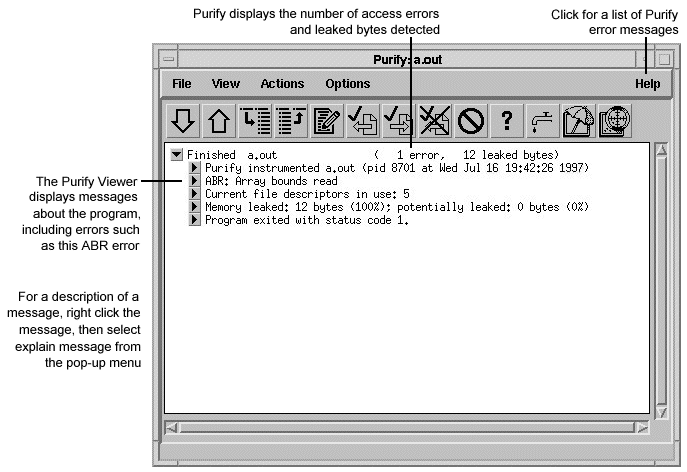
Seeing all your errors at a glance
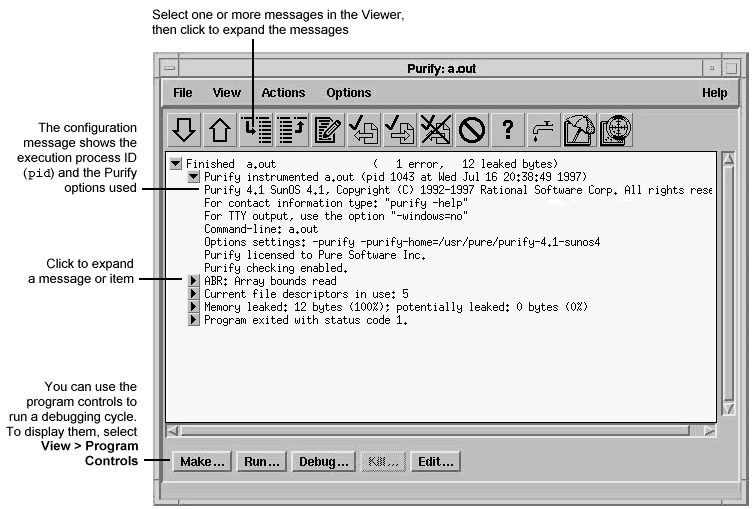
The Purify Viewer displays the results of the run of the instrumented Hello World program. You can expand each message to see additional details.
Note: The Viewer displays messages for a single executable only. It is specific to the name of the executable, the directory containing the executable, and the user ID.
Finding and correcting errors
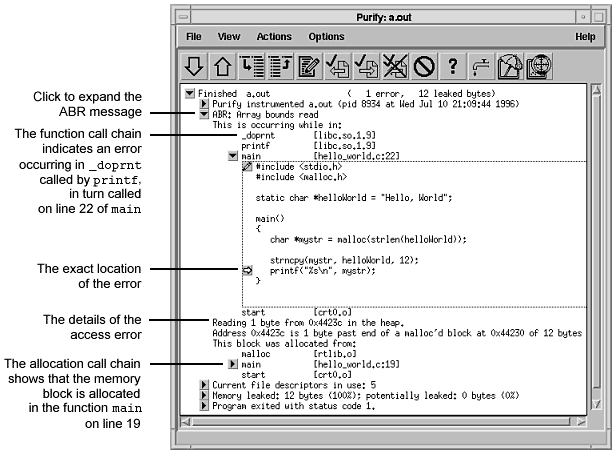
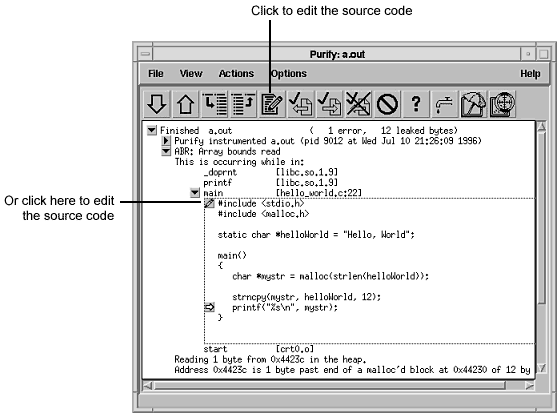
Purify reports an array bounds read (ABR) memory access error in the Hello World program. You can expand the ABR message to see the exact location of the error.
Note: To make debugging easier, Purify reports line numbers, source filenames, and local variable names whenever possible if you use the -g compiler option when you instrument the program. If you do not use the -g option, Purify reports only function names and object filenames.
On IRIX, system libraries retain their source file and line number information; therefore, the
can appear next to a system library function whose source file is not available. When you click the
Understanding the cause of the error
To understand the cause of the ABR error, look at the code in hello_world.c again.
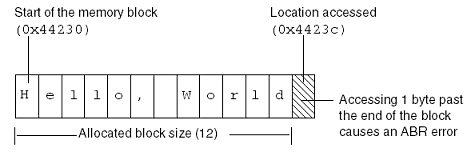
On line 22, the program requests printf to display mystr, which is initialized by strncpy on line 21 for the 12 characters in "Hello, World". However, _doprnt is accessing one byte more than it should. It is looking for a NULL byte to terminate the string. The extra byte for the string's NULL terminating character has not been allocated and initialized.
For more information, see How Purify finds memory-access errors.
Correcting the ABR error
To correct this ABR error:
- Click the Edit tool
to open an editor.
Note: By default, Purify displays seven lines of the source code file in the Viewer. You can change the number of lines of source code displayed by setting an X resource.
- Change lines 19 and 21 as follows:
19  char *mystr = malloc(strlen(helloWorld)+1) ;
20
21  strncpy(mystr, helloWorld,13) ;
Finding leaked memory
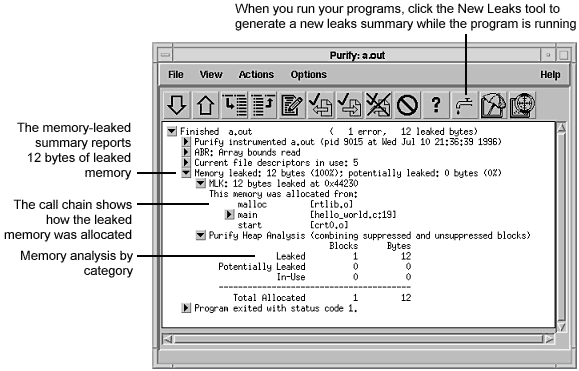
When a program exits, Purify searches for memory leaks and reports all memory blocks that were allocated but for which no pointers exist.Note: When you run longer-running instrumented programs, you can click the New Leaks tool to generate a new leaks summary while the program is running.
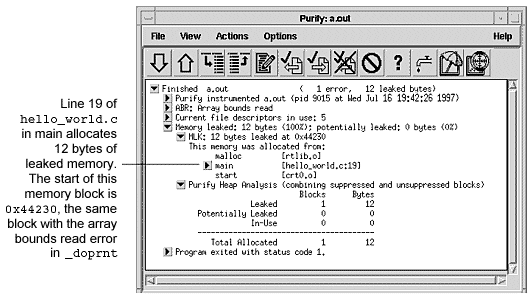
- Expand the memory-leaked summary for Hello World.
The memory-leaked summary shows the number of leaked bytes as a percentage of the total heap size. If there is more than one memory leak, Purify sorts them by the number of leaked bytes, displaying the largest leaks first.
- Expand the MLK message.
Correcting the MLK error
It is not immediately obvious why this memory was leaked. If you look closer, however, you can see that this program does not have an exit statement at the end. Because of this omission, the main function returns rather than calls exit, thereby making mystr --the only reference to the allocated memory--go out of scope.
If main called exit at the end, mystr would remain in scope at program termination, retaining a valid pointer to the start of the allocated memory block. Purify would then have reported it as memory in use rather than memory leaked. Alternatively, main could free mystr before returning, deallocating the memory so it is no longer in use or leaked.
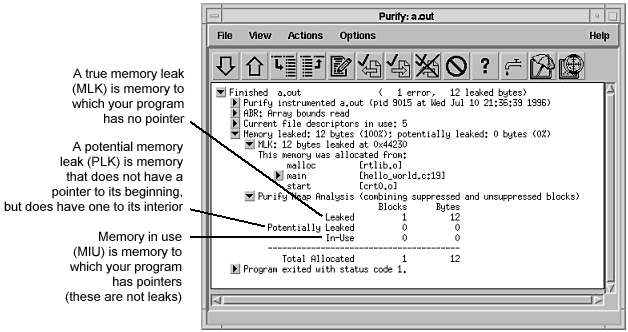
Looking at the heap analysis
Purify distinguishes between three memory states, reporting both the number of blocks in each state and the sum of their sizes:
The exit status message provides information about:
- Basic memory usage containing statistics not easily available from a single shell command. It includes program code and data size, as well as maximum heap and stack memory usage in bytes.
- Shared-library memory usage indicating which libraries were dynamically linked and their sizes.
Comparing program runs
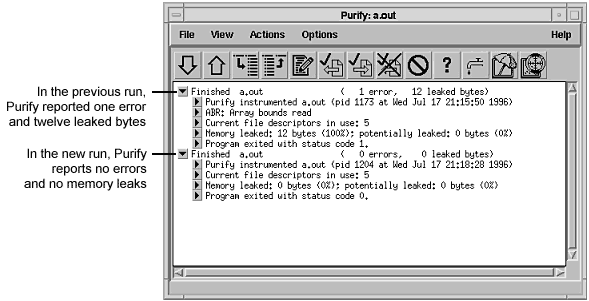
To verify that you have corrected the ABR and MLK errors, recompile the program with purify, and run it again.Purify displays the results of the new run in the same Viewer as the previous run so it's easy to compare them. In this simple Hello World program, you can quickly see that the new run no longer contains the ABR and MLK errors.
Congratulations! You have successfully Purify'd the Hello World program.
Suppressing Purify messages
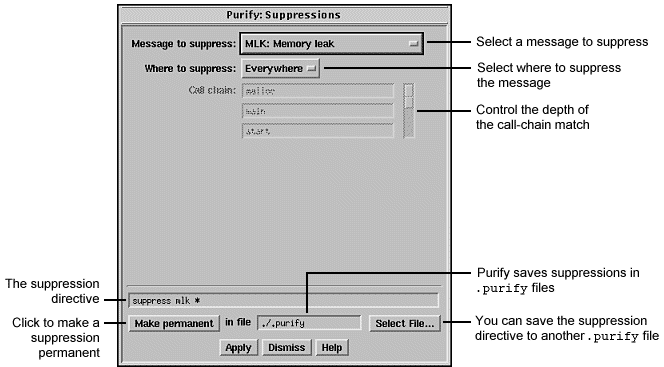
A large program can generate hundreds of error messages. To quickly focus on the most critical ones, you can suppress the less critical messages based on their type and source. For example, you might want to hide all informational messages, or hide all messages that originate in a specific file.You can suppress messages in the Viewer either during or after a run of your program. To suppress a message in the Viewer:
Purify displays the Suppressions dialog, containing information about the selected message.
You can also specify suppressions directly in a .purify file. Suppressions created in the Viewer take precedence over suppressions in .purify files; however, they apply only to the current Purify session. Unless you click Make permanent, they do not remain when you restart the Viewer.
Saving Purify output to a view file
A view file is a binary representation of all messages generated in a Purify run that you can browse with the Viewer or use to generate reports independent of a Purify run. You can save a run to a view file to compare the results of one run with the results of subsequent runs, or to share the file with other developers.Saving a run to a view file from the Viewer
To save a program run to a view file from the Viewer:
- Wait until the program finishes running, then click the run to select it.
- Select File > Save As.
- Type a filename, using the .pv extension to identify the run as a Purify view file.
Opening a view file
To open a view file from the Viewer: Purify displays the run from the view file in the Viewer. You can work with the run just as you would if you had run the program from the Viewer.You can also use the -view option to open a view file. For example:
% purify -view <filename>.pvThis opens the <filename>.pv view file in a new Viewer.Using your debugger with Purify
You can run an instrumented program directly under your debugger so that when Purify finds an error, you can investigate it immediately.Alternatively, you can enable Purify's just-in-time (JIT) debugging feature to have Purify start your debugger only when it encounters an error - and you can specify which types of errors trigger the debugger. JIT debugging is useful for errors that appear only once in a while. When you enable JIT debugging, Purify suspends execution of your program just before the error occurs, making it easier to analyze the error.
Using Purify with PureCoverage
Purify is designed to work closely with PureCoverage, Rational Software's runtime test coverage tool. PureCoverage identifies the parts of your program that have not yet been tested so you can tell whether you're exercising your program sufficiently for Purify to find all the memory errors in your code.To use Purify with PureCoverage, add both product names to the front of your link line. Include all options with the program to which they refer. For example:
% purify <purifyoptions> purecov <purecovoptions> \
    cc -g hello_world.c -o hello_world
To start PureCoverage from the Purify Viewer, click the PureCoverage icon
in the toolbar.
For more information, see Using Rational PureCoverage.
Purify API functions
You can call Purify's API functions from your source code or from your debugger to gain more control over Purify's error checking. By calling these functions from your debugger, you get additional control without modifying your source code. You can use Purify's API functions to check memory state and to search for memory and file-descriptor leaks.For example, by default Purify reports memory leaks only when you exit your program. However, if you call the API function purify_new_leaks at key points throughout your program, Purify reports the memory leaks that have occurred since the last time the function was called. This periodic checking enables you to locate and track memory leaks more effectively.
To use Purify API functions, include <purifyhome>/purify.h in your code and link with <purifyhome>/purify_stubs.a.
Build-time options
Specify build-time options on the link line when you instrument a program with Purify. For example:% purify -cache-dir=$HOME/cache -always-use-cache-dir cc ...Conversion characters for filenames
Use these conversion characters when specifying filenames for options such as -log-file and -view-file.Runtime options
Specify runtime options on the link line or by using the PURIFYOPTIONS environment variable. For example:% setenv PURIFYOPTIONS "-log-file=mylog.%v.%p 'printenv PURIFYOPTIONS'"
Purify messages
Purify reports the following messages:* Message severity: F=Fatal, C=Corrupting, W=Warning, I=InformationalHow Purify finds memory-access errors
Purify monitors every memory operation in your program, determining whether it is legal. It keeps track of memory that is not allocated to your program, memory that is allocated but uninitialized, memory that is both allocated and initialized, and memory that has been freed after use but is still initialized.Purify maintains a table to track the status of each byte of memory used by your program. The table contains two bits that represent each byte of memory. The first bit records whether the corresponding byte has been allocated. The second bit records whether the memory has been initialized. Purify uses these two bits to describe four states of memory: red, yellow, green, and blue.
Purify checks each memory operation against the color state of the memory block to determine whether the operation is valid. If the program accesses memory illegally, Purify reports an error.
- Red: Purify labels heap memory and stack memory red initially. This memory is unallocated and uninitialized. Either it has never been allocated, or it has been allocated and subsequently freed.
In addition, Purify inserts guard zones around each allocated block and each statically allocated data item, in order to detect array bounds errors. Purify colors these guard zones red and refers to them as red zones. It is illegal to read, write, or free red memory because it is not owned by the program.
- Yellow: Memory returned by malloc or new is yellow. This memory has been allocated, so the program owns it, but it is uninitialized. You can write yellow memory, or free it if it is allocated by malloc, but it is illegal to read it because it is uninitialized. Purify sets stack frames to yellow on function entry.
- Green: When you write to yellow memory, Purify labels it green. This means that the memory is allocated and initialized. It is legal to read or write green memory, or free it if it was allocated by malloc or new. Purify initializes the data and bss sections of memory to green.
- Blue: When you free memory after it is initialized and used, Purify labels it blue. This means that the memory is initialized, but is no longer valid for access. It is illegal to read, write, or free blue memory.
Since Purify keeps track of memory at the byte level, it catches all memory-access errors. For example, it reports an uninitialized memory read (UMR) if an int or long (4 bytes) is read from a location previously initialized by storing a short (2 bytes).
How Purify checks statically allocated memory
In addition to detecting access errors in dynamic memory, Purify detects references beyond the boundaries of data in global variables and static variables; that is, data allocated statically at link time as opposed to dynamically at run time.Here is an example of data that is handled by the static checking feature:
int array[10];
main() {
  array[11] = 1;
}
In this example, Purify reports an array bounds write (ABW) error at the assignment to array[11] because it is 4 bytes beyond the end of the array.
Purify inserts red zones around each variable in your program's static-data area. If the program attempts to read from or write to one of these red zones, Purify reports an array bounds error (ABR or ABW).
Purify inserts red zones into the data section only if all data references are to known data variables. If Purify finds a data reference that is relative to the start of the data section as opposed to a known data variable, Purify is unable to determine which variable the reference involves. In this case, Purify inserts red zones at the beginning and end of the data section only, not between data variables.
Purify provides several command-line options and directives to aid in maximizing the benefits of static checking.
Copyright© 1992-2003 Rational Software Corporation. All rights reserved.