Tivoli Header

User's Guide

Viewing Tivoli Business Systems Manager Data

Tivoli Business Systems Manager data can be viewed from the Java Console, as shown in Figure 9. The activity takes place without any interaction with Tivoli Monitoring components.

Figure 9. Data flow for viewing Tivoli Monitoring data in Tivoli Business Systems Manager
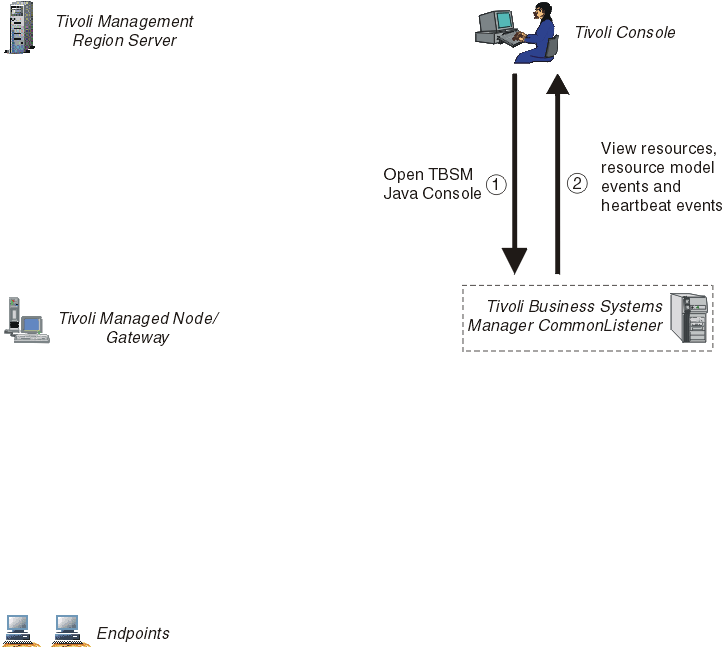
This figure shows the Open JConsole being used from the Tivoli Desktop to view all data originating from Tivoli Monitoring, without any direct interaction with the product.

The data is viewed with Tivoli Business Systems Manager, as shown in the following Tivoli Business Systems Manager dialog.
This dialog is from Tivoli Business Systems Manager. A full interpretation of the image is given in the text that follows.
This dialog shows the All Resources view of Tivoli Business Systems Manager. A Business Object Container has been opened to show an enterprise with at least two IP networks. IP network 69 has been opened to show a single subnet and segment within which are a number of computers. Computer lab03110-nt has been opened to show two entities:

Operating System
The properties of this object contain information about the resources of the computer, including the Tivoli Monitoring events.

Software Element
The properties of this object contain the heartbeat information.

Note:
For every subnet in the enterprise hierarchy you can configure a subnet mask using the wdmconfig command (see Configuring Tivoli Business Systems Manager Adapter).


[ Top of Page | Previous Page | Next Page | Table of Contents | Index ]