
 |
 |
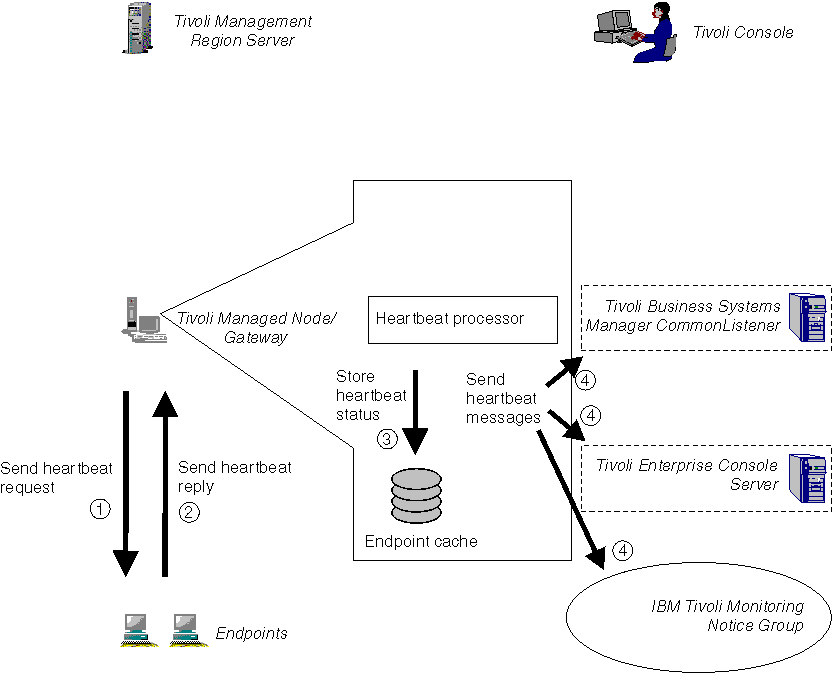
Figure 6 shows the data flow for the heartbeat function at a gateway in a Tivoli management region, with all possible monitors configured to receive the heartbeat events.
Figure 6. Data flow for heartbeat function at gateway

The gateway issues periodic heartbeat requests to all attached endpoints (step 1). The data that is returned by the endpoints (step 2) is stored in the endpoint cache (step 3) and sent to whichever of the monitors is configured to receive it (step 4).