
 |
 |
In addition to the monitors described in the previous section, it is also possible to view the heartbeat information in the endpoint cache, using the wdmmngcache command.
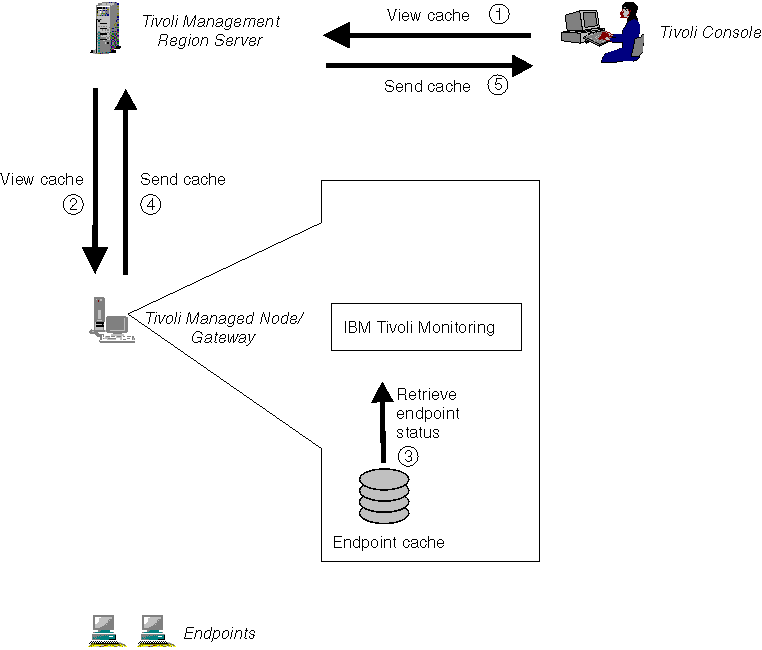
Figure 7. Data flow using wdmmngcache command

This diagram shows the data flow when a wdmmngcache command is issued at the Tivoli Desktop. A request is sent to the gateway (steps 1 and 2), which interrogates the cache (step 3) and sends the information back to the desktop (steps 4 and 5). There is no interaction with the endpoints in this data flow. Data can also be deleted from the cache using this command.
The wdmmngcache command has two output formats. If the -v option is not used, a line is provided for each endpoint, showing the heartbeat status, as follows:
Processing ManagedNode mpulp...
Processing ManagedNode dmw2k2...
Endpoint                                 | Status
-----------------------------------------+-------
mpulp-ep                                   Alive
dmw2k2-ep                                  Alive
If the -v option is used, the command provides information about the discovery status of the endpoints, as follows:
Processing ManagedNode mcrudele...
Processing ManagedNode dmw2k2...
Warning: DM_Adv_Edition feature not installed on the Managed Node 'boccaccio'. Skipping...
Endpoint             | HB status            | TBSM status
---------------------+----------------------+--------------------
dmw2k2-ep              DMEngineOff            Not discovered
mcrudele-ep            DMEngineOff            Not discovered