Business Intelligence Tutorial
In this lesson, you will create a hierarchy in one of the
dimensions. Hierarchies organize parent-child relationships among the
columns of a dimension and are displayed as a tree structure. For
example, in the Time dimension, you might define the Year member as the top of
the hierarchy. The Quarter member would be a child of Year, and Month
would be a child of Quarter.
In this exercise, you will create a hierarchy in the Markets
dimension.
- Select the Market dimension in the field on the left side of the Define
Hierarchy page and click Add Hierarchy. The Add Hierarchy
window is displayed.
- In the Name field, type Region-City exactly as shown
here (without spaces) and click Done. Notice that columns in
the Market dimension are now displayed in the Dimension Columns
field on Define Hierarchy page.
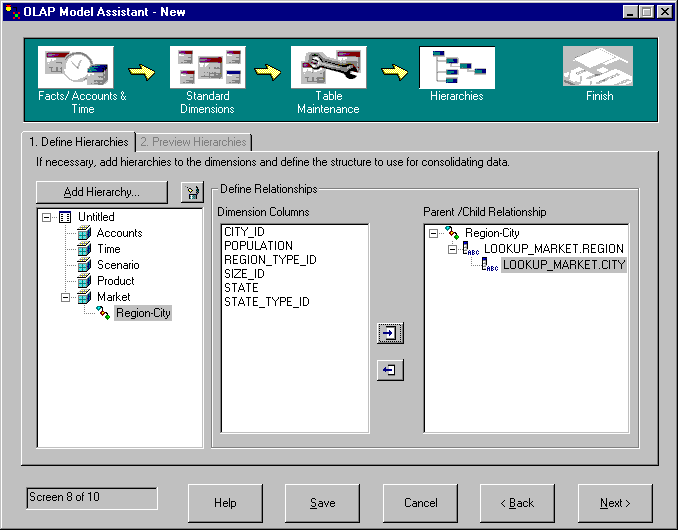
- Select the Region column in the Dimension Columns
field and click the right arrow button. The Region column is added to
the Parent/Child Relationship field.
- Select the City column and click the right arrow button.
The City column is displayed as a child of Region column in the
Parent/Child Relationship field. The window looks like
this:

- Click Next and the Preview Hierarchies page is
displayed.
In this exercise, after you have created all the hierarchies you want,
you can see what kind of data they will present in the Preview Hierarchies
page.
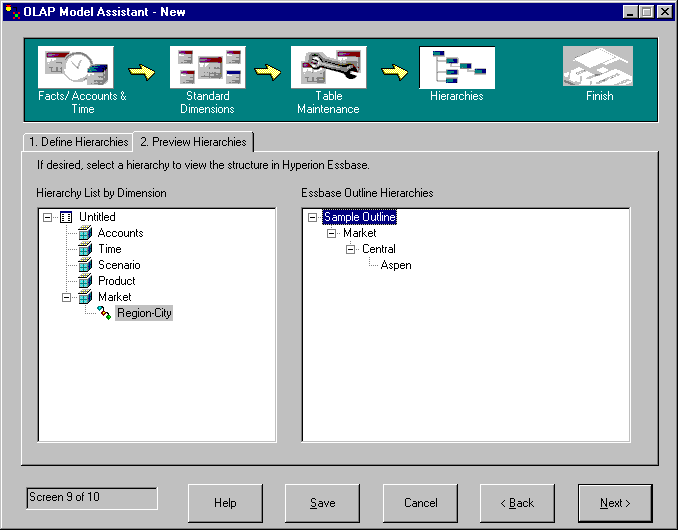
- Open the tree structure for the Market dimension in the Hierarchy
List by Dimension field.
- Click Region-City and a sample Market outline appears in the
Essbase Outline Hierarchies field. The window looks like
this:

- Click Next and the final window of the OLAP Model Assistant is
displayed.
In this lesson, you created and reviewed a hierarchy in the Market
dimension.
[ Top of Page | Previous Page | Next Page ]


