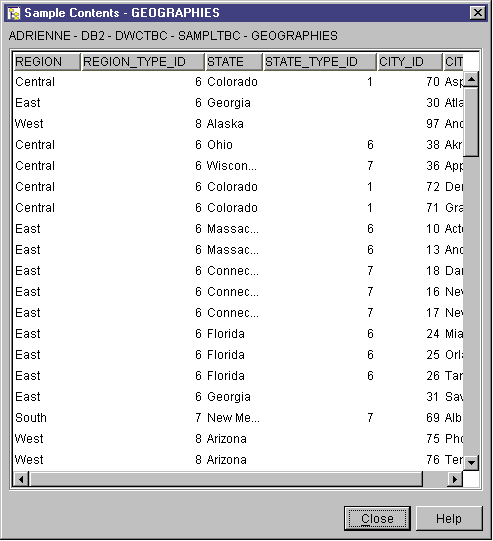
Up to 200 rows of the table are displayed. The column names are displayed at the top of the window. You might need to scroll to the right to see all the columns and scroll down to see all the rows.
In this lesson, you will browse the source data that is available to you in the sample. You will investigate ways that you can transform this data into the star schema for the warehouse.
Source data is not always well structured for analysis and might need to be transformed to be more usable. The source data that you will be using consists of DB2 Universal Database tables and a text file. Some other typical types of source data are non-DB2 relational tables, MVS(TM) data sets, and Microsoft Excel spreadsheets. As you browse the data, look for relationships among the data and consider what information might be of the most interest to users.
In general, when you design a warehouse, you gather information about the operational data to use as input to the warehouse and the requirements for the warehouse data. The database administrator who is responsible for the operational data is a good source for information about the operational data. The business users who will be making business decisions based on the data in the warehouse are a good source for information about the requirements of the warehouse.
In this exercise, you will use the DB2 Control Center to view the first 200 rows of a table.
To view the table:

Up to 200 rows of the table are displayed. The column names are displayed at the top of the window. You might need to scroll to the right to see all the columns and scroll down to see all the rows.
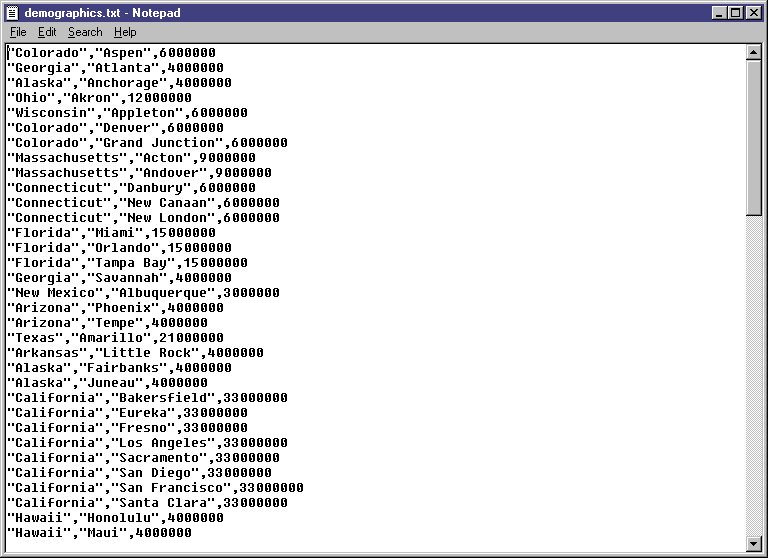
In this exercise, you will use the Microsoft Notepad to view the contents of the demographies.txt file.
To view the file:

Note that the file is comma-delimited. You will need to supply this information in a later lesson.
In this lesson, you viewed the GEOGRAPHIES source table and the demographics.txt file, which are provided in the Data Warehousing sample. In the next lesson, you will open to the Data Warehouse Center and start defining your warehouse.