OLAP Spreadsheet Add-in User's Guide for 1-2-3
Hyperion Essbase provides you with various ways to customize the worksheet
view. For example, you may want to apply visual cues, or styles, to
certain member names or to data cells in the worksheet, or you may want to
display alternative names, or aliases, for member names. This section
steps you through the following formatting procedures:
This section of the tutorial starts with a new worksheet.
In a spreadsheet report, you may have many hierarchical levels of database
information displayed. By defining and applying visual cues, or styles,
to the text and cells in the worksheet, you can easily keep track of specific
database members, dimensions, and cell functions. Styles are a great
way to help view and distinguish data in Hyperion Essbase Spreadsheet
Add-in.
| Note: | Keep in mind that applying styles requires additional processing during a
retrieval request. For more information, see Removing Styles.
|
This section of the tutorial describes the following:
| Note: | For a discussion of the relationships among Hyperion Essbase database
members, see Database Outlines"Database Outlines" on page 29.
|
Each dimension in a database may contain a large number of hierarchical
levels. As you view data in the worksheet, you may not be familiar with
all the hierarchical levels of the database outline. To indicate which
members have underlying children, you can apply formatting styles to parent
members, including those with attributes.
To apply styles to parent members:
- To open a new worksheet, select File > New or click the

icon.
- Select Essbase > Retrieve.
| Note: | You should still be connected to the Sample Basic database. If you are
not connected, follow the steps in Connecting to a Database.
|
- In cell A2, drill down (double-click) on Year.
- Select Essbase > Options.
- In the Essbase Options dialog box, select the Style
tab.
| Note: | The Style tab is available only when you are connected to a
database.
|
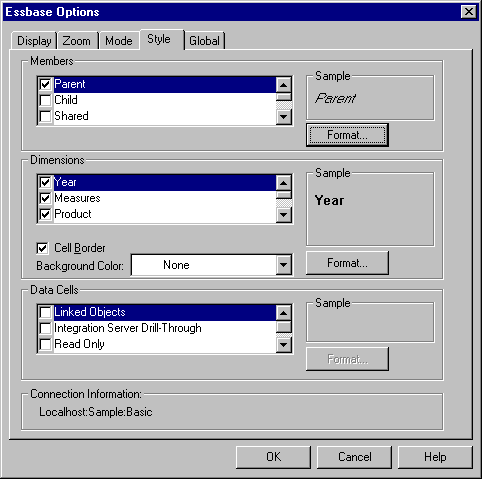
Hyperion Essbase displays the Styletab.
Figure 45. Essbase Options Dialog Box, Style Tab
In the Members area, you can define styles for various types of database
members, such as parent, child, and shared members.
- In the Members group box, click the Parent check box.
Clicking this box defines a font and color style for parent member
names. Hyperion Essbase defines a default color of navy for all parent
members. You can select a font format by clicking the Format button to
the right of the Members box and using the Font dialog box.
- Click the Format button.
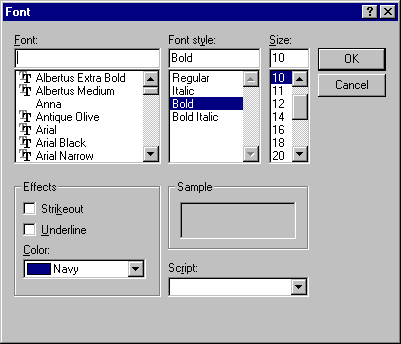
Hyperion Essbase displays the Font dialog box.
Figure 46. Font Dialog Box
- In the Font style list box, select Bold and then click
OK.
| Note: | Hyperion Essbase displays an example of the selected style in the Sample
box.
|
- Click OK again.
Even though you have defined styles, they are not enabled until you click
the Use Styles check box from the Essbase Options dialog box and
refresh the worksheet.
- Select Essbase > Options, and select the Display tab.
- In the Cells option group, click the Use Styles check box to
enable your styles, and then click OK.
- Select Essbase > Retrieve to refresh the worksheet and apply the
styles.
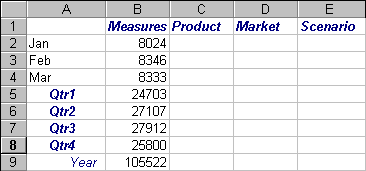
Hyperion Essbase displays parent member names in bold, navy font.
- In cell A2, drill down (double-click) on Qtr1.
Hyperion Essbase displays Jan, Feb, and Mar in a regular font, because
these members do not have underlying children.
Figure 47. Styles Applied to Parent Members
In addition to applying styles to parent members (as you did in the
previous section), you can also apply styles to members of a dimension in a
database. Applying styles to dimensions makes it easy to view the
various dimension members in Hyperion Essbase Spreadsheet Add-in.
To apply styles to dimensions:
- Select Essbase > Options and select the Style tab.
- In the Dimensions group box, select Year.
- Select the Cell Border check box to create a border around each
cell that contains a member from the selected dimension.
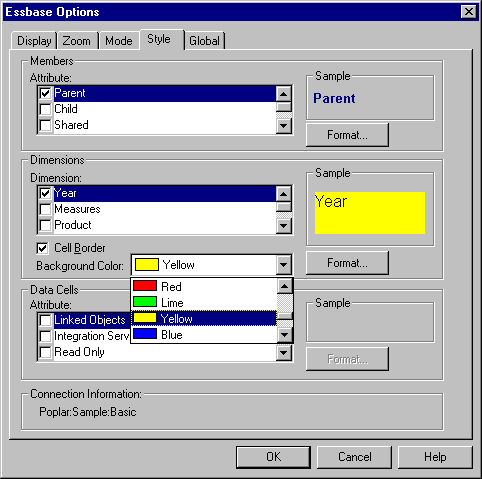
- From the Background Color list box, select Yellow.
Figure 48. Selecting a Background Color from the Style Tab
- Click the Format button that is to the right of the Dimensions
list. Hyperion Essbase displays the Font dialog box.
- From the Font style list box, select Bold, and then click
OK.
| Note: | Hyperion Essbase displays an example of the selected style in the Sample
box.
|
- From the list of dimensions, select the Measures dimension and, from the
Background Color list box, select Fuschia.
- From the list of dimensions, select Product, and clear the Cell
Border check box.
- From the Background Color list box, select Aqua.
- Scroll down the list of dimensions, and select Market.
- Select the Cell Border check box, and click the
Format button that is to the right of the Dimensions list.
When the Font dialog box is displayed, from the Font
style list box select Italic, and then click OK.
- From the list of dimensions, select Scenario, and from the Background
Color list box, select Red.
- Click the Format button, and from the Color list
box, select White.
- Click OK twice to return to the worksheet.
| Note: | When you define styles, your choices are saved to the
essbase.ini file on your local machine. You can
define one set of styles per database.
|
- In cell D1, drill down (double-click) on Market.
- Press and hold the Alt key and drill down (double-click) on Scenario (in
cell E1).
- Select Essbase > Retrieve to refresh the worksheet.
Hyperion Essbase redisplays the worksheet and implements the newly defined
styles. For example, members of the Scenario dimension are displayed
with a red background.
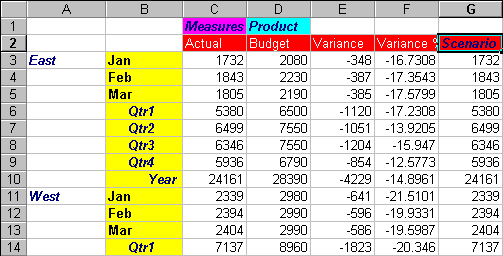
Figure 49. Dimensions with Styles Applied
You can apply styles to data cells, such as read-only cells, read/write
cells, linked object cells, and Hyperion Integration Server Drill-Through
cells to distinguish them from other cells in the worksheet. The Sample
Basic database that you are using for this tutorial does not contain data
cells with any of these characteristics. In the advanced tutorial
presented in Chapter 3, you attach a linked reporting object to a data cell
and apply a style to the cell.
| Note: | You cannot perform the actions in shaded boxes.
|
|
In general, you apply styles to data cells by following these steps:
- Select Essbase > Options, and select the Style tab.
- In the Data Cells option group, click the Linked Objects,
Integration Server Drill-Through, Read Only, or Read/Write check box.
- Click Format.
- In the Font dialog box, specify the font, font size, font
style, color, and effects, and click OK.
| Note: | Hyperion Essbase displays an example of the selected style in the
Sample box.
|
Sample Style for Read/Write Data Cells

|
- Repeat steps 2-4 to set styles for other data cells.
- Select the Display tab and select the Use Styles
check box to apply styles to the worksheet.
- Click OK to close the Essbase Options dialog box.
- Select Essbase > Retrieve to display the new styles in the
worksheet.
|
The only way you can apply a background color to data is to
define a style for dimensions. If dimension styles are defined, and the
Use Styles setting is turned on, members of a dimension always have the
background color defined for their dimension.
The text styles that you can apply to members, dimensions, and data cells
have a hierarchy that determines which characteristics are applied.
Member styles are at the top of that hierarchy. Thus, member styles are
always applied (as long as styles are turned on). Note that in Figure 47, the Qtr1 label in cell B6 is in bold, navy font, and has a
yellow background. The navy font comes from the style defined for
parent members, and the yellow background comes from the style defined for
Year.
Hyperion Essbase uses the following order of precedence when applying
multiple text styles:
- Linked object cells
- Integration Server Drill-Through cells
- Read-only cells
- Read/write cells
- Parent member cells
- Child member cells
- Shared member cells
- Cells containing formulas
- Dynamic calculation member cells
- Attribute cells
- Dimension cells
If you want to see a child member style,
make sure that the parent member style is turned off. If you want to
see a shared member style, make sure that both parent and child member styles
are turned off.
Styles can be very helpful tools for keeping track of data in Hyperion
Essbase Spreadsheet Add-in. Applying styles, however, involves
additional processing time during a retrieval request. This additional
processing has a slight impact on the speed of Hyperion Essbase
retrievals.
If you do not want to apply styles to the worksheet view, you can clear
them. You can also turn off styles so they are not displayed when you
refresh the view (by selecting Essbase > Retrieve, for example). So
that the worksheet matches the illustrations presented in the following tasks,
do not remove styles if you are stepping through the
tutorial.
| Note: | If you have styles applied to the worksheet and you execute the FlashBack
command, these styles are temporarily removed from the current view.
The styles are re-applied whenever you initiate a retrieval. You cannot
perform the actions in shaded boxes.
|
|
To remove all styles from a worksheet:
- Select all cells in the worksheet.
- From the Lotus 1-2-3 menu bar, select Edit > Clear > Styles.
To disable styles:
- Select Essbase > Options and, select the Display tab.
- In the Cells option group, clear the Use Styles
check box, and click OK.
|
| Note: |
If you turn styles off without clearing them
from the worksheet, the styles remain in the current worksheet view when you
refresh the view. The styles remain to avoid removing any styles that
you may apply to individual cells using native worksheet formatting
options.
|
Aliases are alternate names for database members. You can create
reports that use the database member name, which is often a stock number or a
product code, or an alias name, which can be more descriptive. Aliases
are defined by the Hyperion Essbase application designer. Each database
can contain one or more alias tables.
For example, members of Product in the Sample Basic database are defined as
codes, such as 100 and 200. A descriptive alias for each member of
Product, such as Colas and Root Beer, is defined in an alias table. In
some cases, alias names may vary depending on the combination of other
database members. For example, a Product member may have a different
alias for each market in which it is sold. For more information, see
the Hyperion Essbase Spreadsheet Add-in online help or the Hyperion
Essbase Database Administrator's Guide.
To display the alias of a member rather than its database name:
- In cell C2, double-click the secondary mouse button to drill up on
Actual.
- Press and hold the Alt key and drill down (double-click) on Product (in
cell D1).
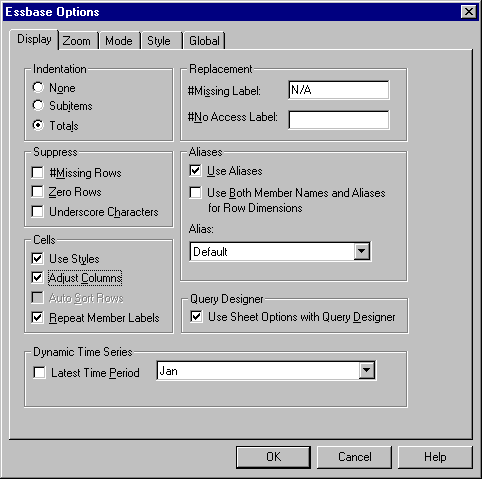
- Select Essbase > Options, and select the Display tab.
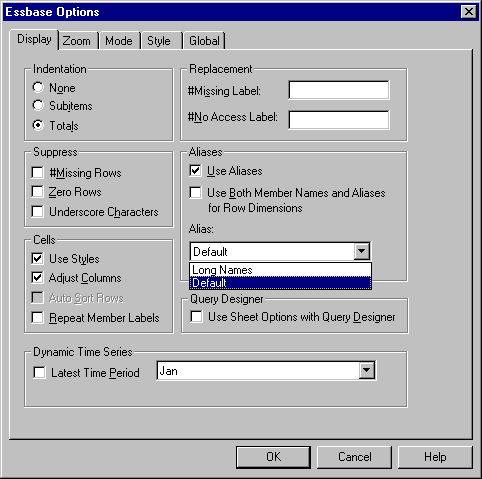
- In the Aliases option group, click the Use Aliases check box to
display member aliases.
- Select Default from the Alias list box.
Figure 50. Enabling Aliases in the Essbase Options Display Tab
- Click OK.
- Select Essbase > Retrieve to refresh the worksheet and display the alias
names.
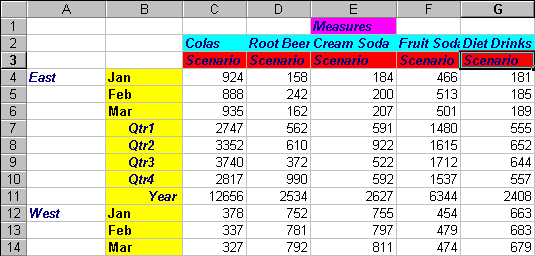
Hyperion Essbase changes the Product codes (100, 200, and so forth) to
their predefined aliases (Colas, Root Beer, Cream Soda, and so forth).
In the Sample Basic database, Product is the only dimension with predefined
aliases.
Figure 51. Result of Displaying Aliases
Notice that Hyperion Essbase is still displaying the styles that you
created and applied in the previous sections.
In addition to displaying aliases for database members, you can also tell
Hyperion Essbase to display both aliases and database member names in Hyperion
Essbase Spreadsheet Add-in.
To display the name and alias of a member:
- In cell B8, double-click the secondary mouse button to drill up on
Qtr2.
- In cell C2, click Colas, and then select Essbase > Pivot.
- In cell C3. click Year, and then select Essbase > Pivot.
- Select Essbase > Options, and select the Display tab.
- In the Aliases option group, select the check box for Use Both
Member Names and Aliases for Row Dimensions.
Be sure that Use Aliases is already checked.
- Click OK to return to the worksheet, and select Essbase > Retrieve.
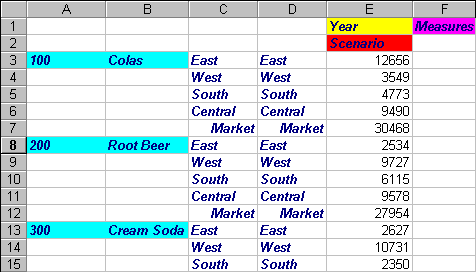
Hyperion Essbase displays both member names and their aliases for row
dimensions. Because the only row dimension in this example that has
preassigned aliases is Product, only the Product members display their
aliases. Region members simply repeat the member name instead of
displaying an alias.
Figure 52. Result of Displaying Both Member Names and Aliases
By default, Hyperion Essbase displays member labels only once for each
nested row and column group. If you are connected to a large database
when using Hyperion Essbase Spreadsheet Add-in, you may have to scroll down or
across the worksheet to see additional data rows and columns. In some
cases, as you scroll down or across, member labels may disappear from
view. Hyperion Essbase provides a feature for repeating member labels
in each row or column cell that represents a data point so that you can always
see a member label in the worksheet view.
To repeat member labels down and across the worksheet:
- Select Essbase > Options, and select the Display tab.
- In the Aliases option group, clear the Use Both Member
Names and Aliases for Row Dimensions check box.
- In the Cells option group, select the Repeat Member
Labels check box, and then click OK.
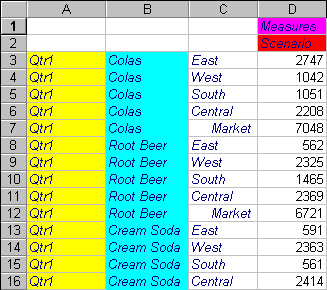
Figure 53. Enabling the Repeat Member Labels Option
- In cell E1, drill down (double-click) on Year.
Hyperion Essbase displays a member label in every column and row
cell. For the Sample Basic database that you are using for this
tutorial, repeating member labels is probably not necessary because the
database is relatively small. This feature is particularly helpful for
keeping track of member labels when scrolling through large worksheets.
Figure 54. Result of Repeating Member Labels
| Note: | Even if you clear the Repeat Member Labels check box in the
Essbase Options dialog box, Hyperion Essbase retains the repeated member
labels in the worksheet view. To remove the repeated labels, you need
to do one of the following: (1) clear the check box and open a new
worksheet; (2) clear the check box and pivot the row group to a column
group and then pivot it back to a row group (or vice versa); or (3)
select Essbase > FlashBack and clear the check box.
|
- Before returning to the tutorial, complete the following actions:
- Select Essbase > Options, and select the Display tab.
- In the Cells option group, clear the Repeat Member
Labels check box, and then click OK.
- Select File > Close to close the worksheet. You do not need to save
the worksheet.
[ Top of Page | Previous Page | Next Page ]

