Connecting from the Connection Status Bar
When an Application Performance Analyzer Connection has been defined, it can be activated from the connection status bar in the lower right corner of the workbench window. Additionally, the status bar includes the capability to add a new connection and also to navigate to the Host Connections view.
Before Starting
At least one Application Performance Analyzer connection must be defined before connecting to Application Performance Analyzer. The currently selected Application Performance Analyzer connection is shown in the connection status bar in lower right corner of the workbench window. To configure a connection, see Configuring an Application Performance Analyzer Connection for more details.
Procedure
If the Application Performance Analyzer Connection to which you want to connect is showing in the connection status bar, click the icon alongside the system name, to activate the connection.
If the connection name to which you want to connect is not the one showing in the connection status bar, click the down arrow alongside the icon in the connection status bar and select the Application Performance Analyzer Connection to which you want to connect. Alternatively, a new connection may be added by selecting “New Application Performance Analyzer Connection” from the drop down list.
Next Steps
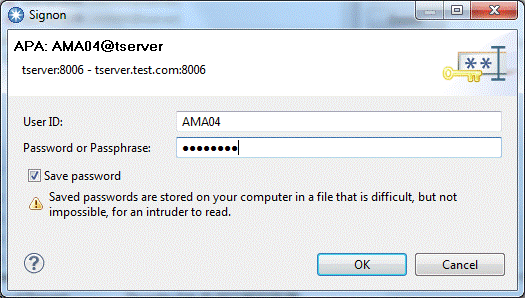
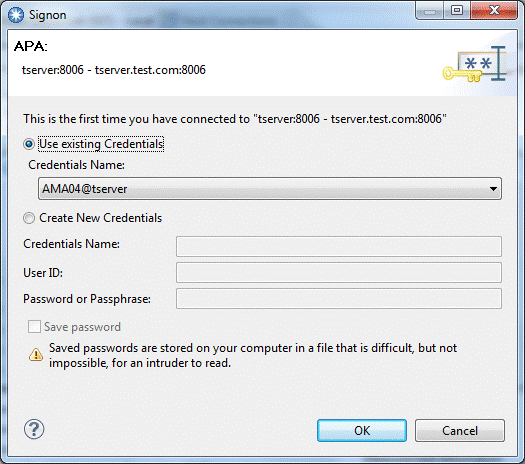
The CICS Explorer® will attempt to connect to the Application Performance Analyzer connection indicated in the system connection status bar. To do this, the Signon window opens and, once successful signon is established, the Application Performance Analyzer remote repository will be populated and displayed.
If the connection is successful, the connection name appears in the connection status bar in lower right corner of the workbench window next to a green icon for a non-SSL connection, or a padlock icon for a SSL connection. The Application Performance Analyzer remote repository will then be populated and displayed.
If the connection is not successful, the connection name appears in the connection status bar in the lower right corner of the workbench window next to a red icon, indicating that the connection failed. An error message is displayed providing a reason for the failure. Check the values in the fields, correct any errors in the connection definition, and click Connect to test the corrections.
Signon Window


If OK was selected, CICS Explorer attempts to connect to Application Performance Analyzer. If there is already a connection to the selected system, the CICS Explorer will reconnect. If the password/pass phrase was not previously entered, you are asked to enter it at this time.

