Getting started with the Application Performance Analyzer GUI
The Application Performance Analyzer GUI is a desktop version of Application Performance Analyzer ISPF. The Application Performance Analyzer GUI encompasses both the Observation Request and Reporting functions, including the R02 screens list, detail views, edit functions and reports for the Observation.
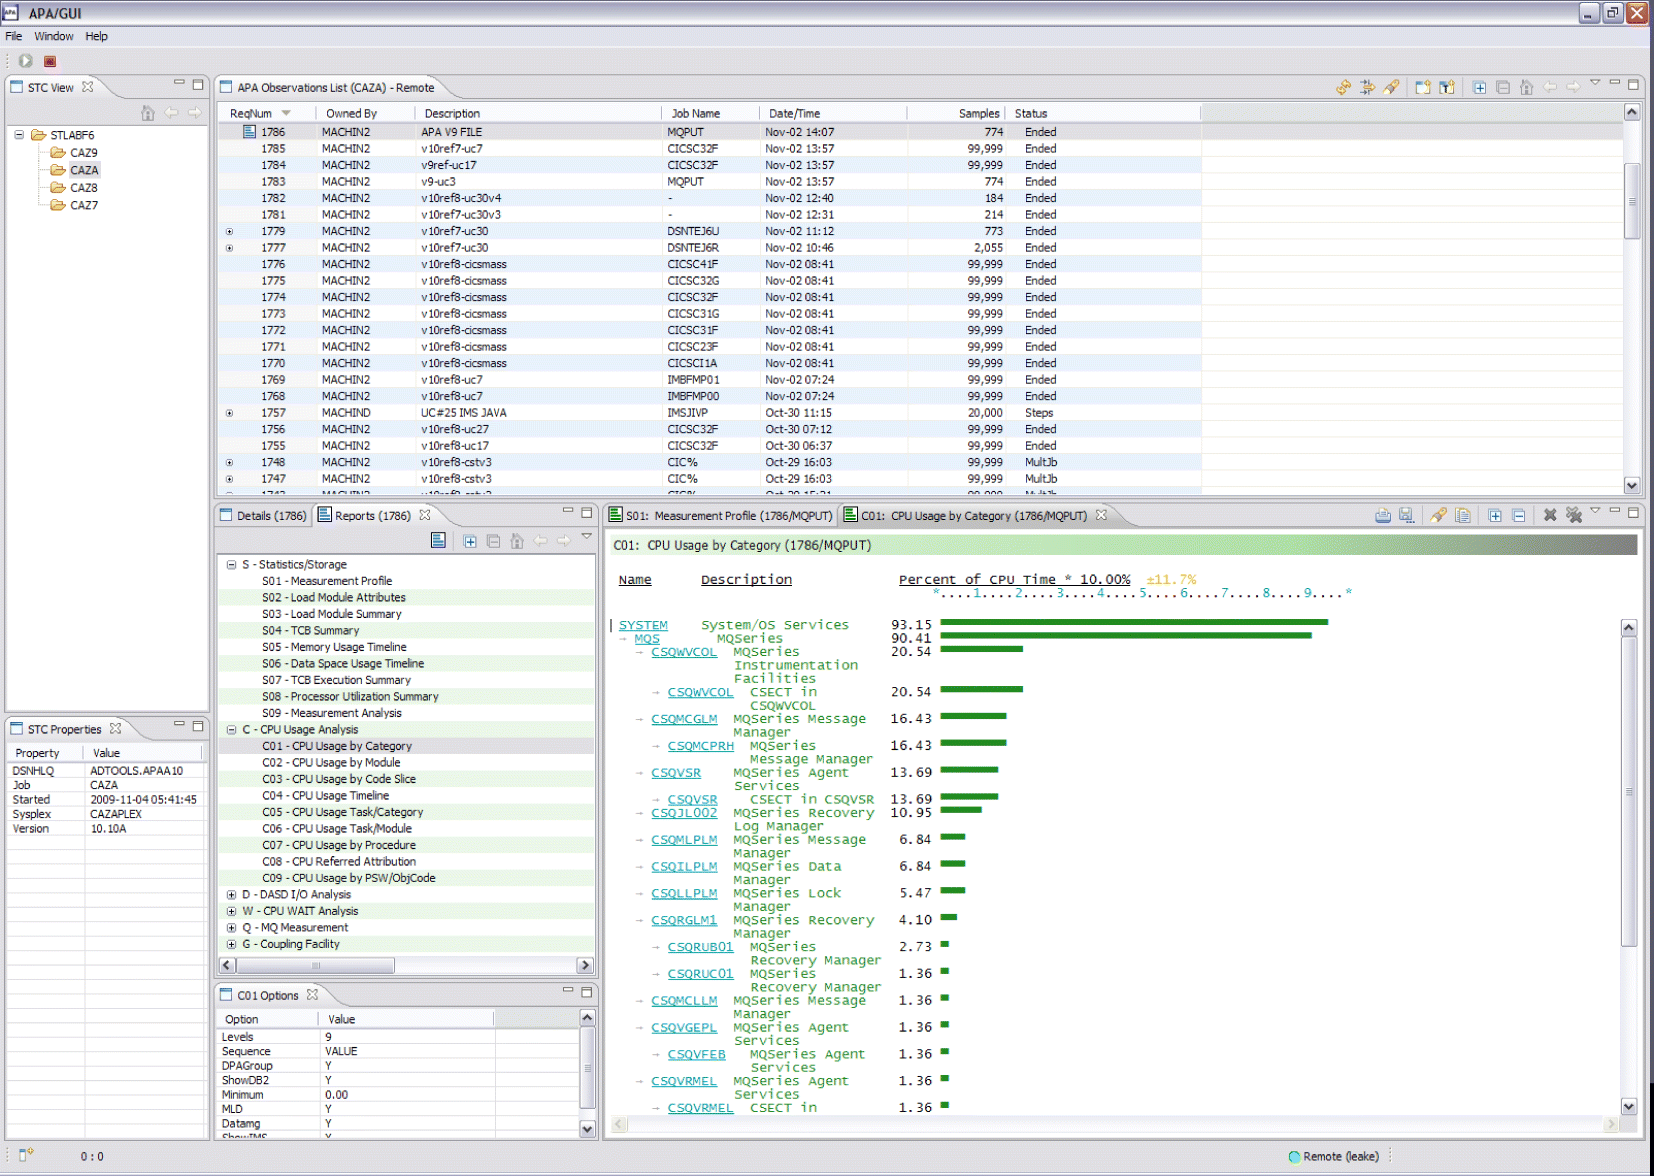
The Application Performance Analyzer GUI is an alternative interface to Application Performance Analyzer, meant to provide a majority of parallel tools and functionality as those from Application Performance Analyzer ISPF, the main interface to Application Performance Analyzer. The Application Performance Analyzer GUI is used for submitting new observation requests and for navigating the Performance Analysis Reports generated from observation requests. The Application Performance Analyzer GUI is organized into several components, which include a menu, tool bars, views, wizards and dialogs. Tool bars are available both from the main application and for most of the views.
- STC View, which lists all active started tasks,
- Observations List View, which lists all observations,
- Observation Detail View, which provides details of an observation,
- Reports List View, which lists all reports for an observation, and
- Report View, which displays an individual report.
