|
|
|
![]()
Rational® Quantify® is a powerful tool that identifies the portions of your application that dominate its execution time. It supports C and C++ applications, as well as Java applications running on a Solaris SPARC 32-bit Java virtual machine (JVM). Quantify gives you the insight to eliminate performance problems so that your software runs faster. With Quantify, you can:
This chapter introduces the basic concepts involved in using Quantify. For complete information, see the Quantify online help system, including the Java Supplement for Quantify.
Quantify counts machine cycles: For C/C++ code, Quantify uses Object Code Insertion (OCI) technology to count the instructions your program executes and to compute how many cycles they require to execute. Counting cycles means that the time Quantify records in your code is independent of accidental local conditions and, assuming that the input does not change, identical from run to run. The fact that performance data is repeatable enables you to see precisely the effects of algorithm and data-structure changes.
Since Quantify counts cycles, it gives you accurate data at any scale. You do not need to create long runs or make numerous short runs to get meaningful data as you must with sampling-based profilers-one short run and you have the data. As soon as you can run a test program, you can collect meaningful performance data and establish a baseline for future comparison.
Quantify times system calls: Quantify measures the elapsed (wall clock) time of each system call made by your program and reports how long your program waited for those calls to complete. You can immediately see the effects of improved file access or reduced network delay on your program. You can optionally choose to measure system calls by the amount of time the kernel records for the process, which is the same as the time the UNIX /bin/time utility records.
Quantify distributes time accurately: Quantify distributes each function's time to its callers so you can tell at a glance which function calls were responsible for the majority of your program's time. Unlike gprof, Quantify does not make assumptions about the average cost per function. Quantify measures it directly.
Quantify provides performance profiling for Java applications running on a Solaris SPARC 32-bit Java virtual machine (JVM).
Quantify times performance: Quantify times each method as it executes, and collects accurate data about the actual execution of your Java code. You can choose either to record elapsed wall-clock time or to measure the amount of time the kernel records for the process, like the UNIX /bin/time utility. Because data for Java code is based on timing and not counting cycles, as it is for C and C++, performance data for Java code, while reliable for a given run, is not repeatable.
Quantify distributes time accurately: Quantify distributes each method's time to its callers. This helps you detect the methods that are ultimately responsible for bottlenecks in your code.
% quantify cc -g hello_world.c -o hello_world
% hello_world
When the program starts, Quantify prints license and support information, followed by the expected output from your program.
When the program finishes execution, Quantify transmits the performance data it collected to qv, Quantify's data-analysis program.
To collect Java performance data, run Quantify with the -java option, as follows:
% quantify [<Quantify options>] -java <applet viewer> [<applet viewer options>] <html file>
% quantify [<Quantify options>] -java <Java executable> [<Java options>] <class>
% quantify [<Quantify options>] -java <Java executable> [<Java options>] -jar <JAR file>
% quantify [<Quantify options>] -java <exename> [<arguments to exename>]
Note: Quantify can collect line-by-line performance data or method-level data. By default, Quantify uses the line level when debug data, which is stored in class files, is available.
When Quantify starts, it prints license and support information, followed by the expected output from your program.
When the program finishes execution, Quantify transmits the performance data it collected to qv, Quantify's data-analysis program.
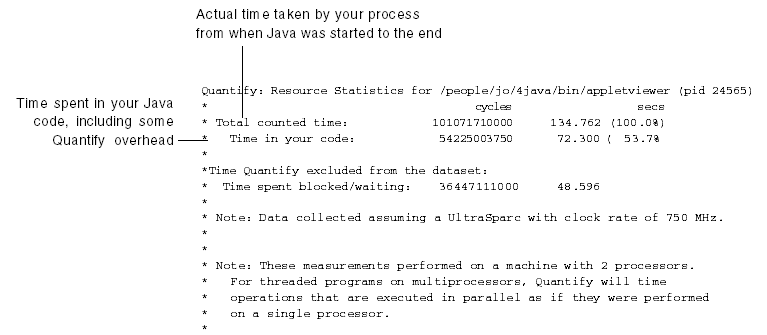
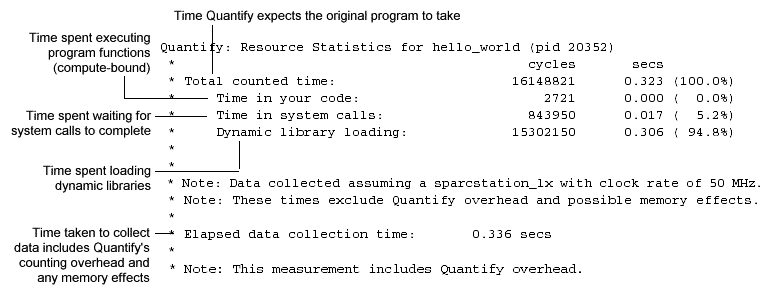
After each dataset is transmitted, Quantify prints a program summary showing at a glance how the original, non-instrumented, program is expected to perform.
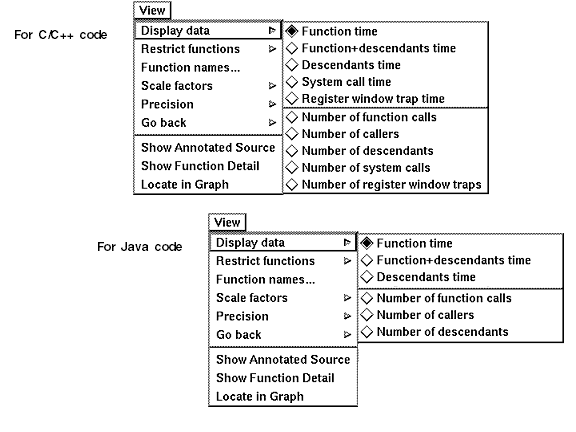
You can restrict the list to the top 20 or top 100 functions in the list, to the functions that have annotated source, to functions that are compute-bound (make no system calls), or to functions that contribute non-zero time for a recorded data type.
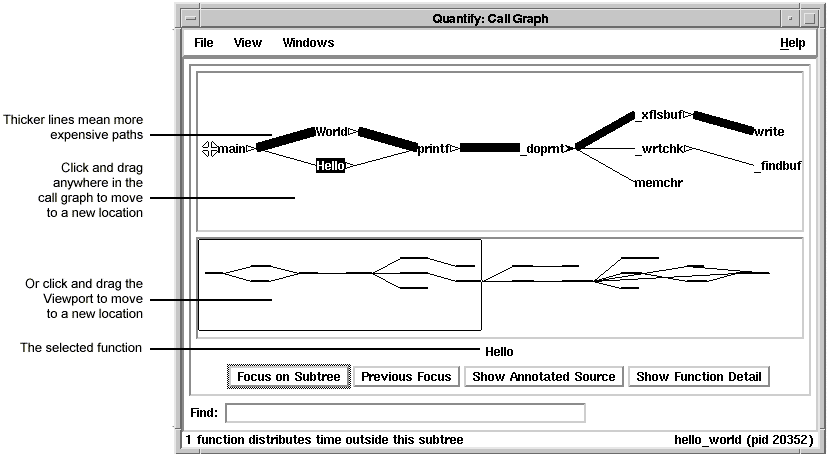
The call graph helps you understand the calling structure of your program and the major call paths that contributed to the total time of the run. Using the call graph, you can quickly discover the sources of bottlenecks.
By default, Quantify expands the call paths to the top 20 functions contributing to the overall time of the program.
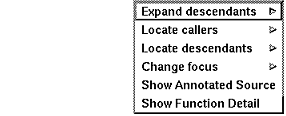
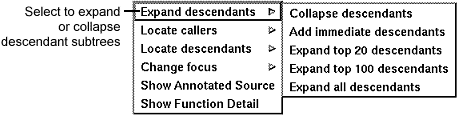
You can use the pop-up menu to:
After expanding or collapsing subtrees, you can select View > Redo layout to remove any gaps that your changes create in the call graph.
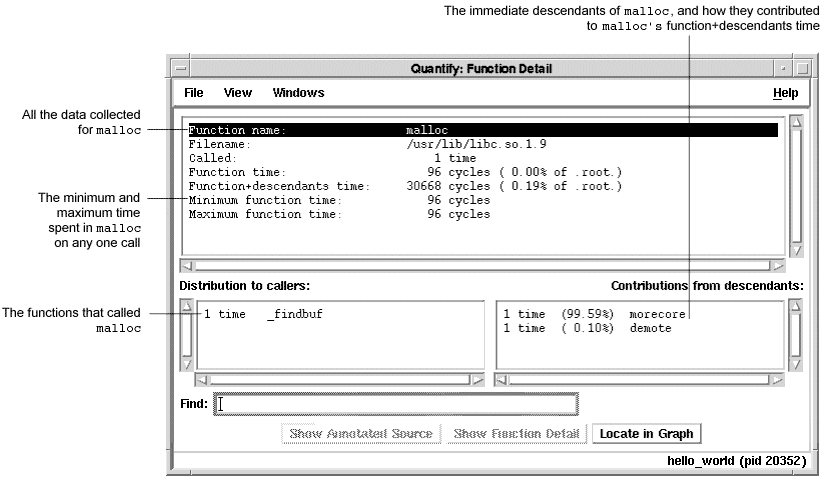
For each function, Quantify reports both the time spent in the function's own code (its function time) and the time spent in all the functions that it called (its descendants time). Quantify distributes this accumulated function+descendants time to the function's immediate caller.
Double-click a caller or descendant function to display the detail for that function.
The function time and the function+descendants time are shown as a percentage of the total accumulated time for the entire run. These percentages help you understand how this function's computation contributed to the overall time of the run. These times correspond to the thickness of the lines in the call graph.
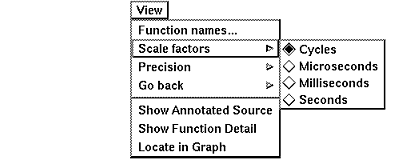
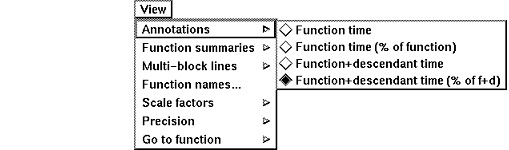
To change the scale of data, select View > Scale factors.
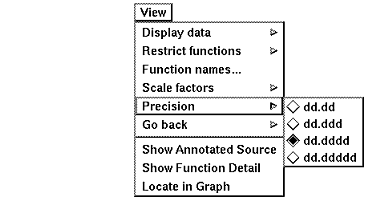
To change the precision of data, select View > Precision.
To append additional function detail displays to the same file, select File > Append to current detail file.
Note: The Annotated Source window is available only for files that you compile using the -g debugging option.
The numeric annotations in the margin reflect the time recorded for that line or basic block over all calls to the function. By default, Quantify shows the function time for each line, scaled as a percentage of the total function time accumulated by the function.
By default, Quantify names dataset files to reflect the program name and its runtime process identifier. You can analyze a saved dataset at a later time by running qv, Quantify's data analysis program.
You can also save Quantify data in export format. This is a clear-text version of the data suitable for processing by scripts.
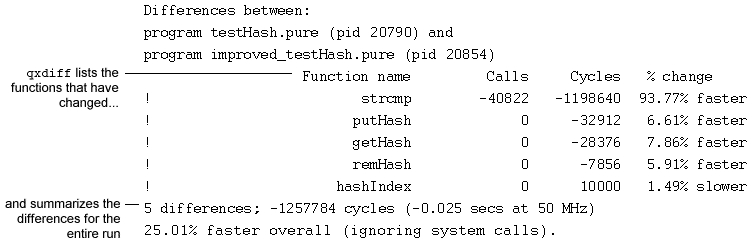
To use the qxdiff script:
% qxdiff -i testHash.pure.20790.0.qx improved_testHash.pure.20854.0.qxYou can use the -i option to ignore functions that make calls to system calls.
Quantify provides command-line options for controlling operations and handling coverage data both for C/C++ and for Java code.
For a C or C++ application, specify build-time options on the link line when you instrument with Quantify. For example:
% quantify -cache-dir=$HOME/cache -always-use-cache-dir cc ...
For a Java application, specify these options (which for Java are not actually build-time options) on the command line when you run the application with Quantify.
For C, C++, and Java applications, you can also set these options using the QUANTIFYOPTIONS environment variable. For example:
% setenv QUANTIFYOPTIONS "-always-use-cache-dir"
|
Commonly used build-time options
|
Default
|
|---|---|
|
no
|
|
|
<quantifyhome>/cache
|
|
|
line
|
|
|
none
|
|
|
no
|
|
|
system-dependent
|
|
|
system-dependent
|
% qv -write-summary-file a.out.23.qv
For a C or C++ application, specify build-time options on the link line when you instrument with Quantify. For a Java application, specify these options on the command line when you run the application with Quantify.
For C, C++, and Java applications, you can also set these options using the QUANTIFYOPTIONS environment variable. For example:
% setenv QUANTIFYOPTIONS "-windows=no"; a.out
|
Commonly used runtime options
|
Default
|
|---|---|
|
system-dependent
|
|
|
elapsed-time
|
|
|
no
|
|
|
yes
|
|
|
0.5
|
|
|
none
|
|
|
none
|
|
|
yes
|
|
|
composite
|
|
|
none
|
|
|
/dev/tty
|
|
|
yes
|
You can call an API method from your Java code or from a debugger. Use the following syntax:
import Rational.PureAPI;
. . .
PureAPI.IsRunning()
PureAPI is a Java class that includes all the Quantify API methods that can be used with Java code. The PureAPI class is part of a Java package called Rational.jar, which is located in <quantifyhome>.
You can run class files that include calls to PureAPI methods with or without Quantify: When you run these class files with Quantify, Quantify automatically sets CLASSPATH and LD_LIBRARY_PATH to access Rational.jar and libQProfJ.so. When you run the class files without Quantify, you must add <quantifyhome>/lib32 to your LD_LIBRARY_PATH. In addition, if you do not have a Rational.jar file in your <javahome>/jre/lib/ext directory, you must add <quantifyhome> to your CLASSPATH.
The Java API methods are as follows:
Copyright © 1992-2003 Rational Software Corporation. All rights reserved.