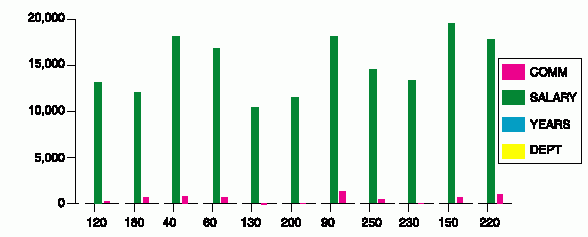
For this example, run the following prompted query:
Figure 137. Use this query to produce the charts for the examples.
+--------------------------------------------------------------------------------+
| PROMPTED QUERY           MODIFIED LINE 1                                       |
|                                                                                |
|   Tables:                                                                      |
|     Q.STAFF                                                                    |
|                                                                                |
|   Columns:                                                                     |
|     ID                                                                         |
|     NAME                                                                       |
|     DEPT                                                                       |
|     JOB                                                                        |
|     YEARS                                                                      |
|     SALARY                                                                     |
|     COMM                                                                       |
|                                                                                |
|   Row Conditions:                                                              |
|     If DEPT Is Equal To 38, 42 Or 51                                           |
|     And JOB Is Not Equal To 'MGR'                                              |
|                                                                                |
|   Sort:                                                                        |
|     Ascending by DEPT                                                          |
|     Ascending by JOB                                                           |
|                                                                                |
|   *** END ***                                                                  |
|                                                                                |
+--------------------------------------------------------------------------------+
To display this report using the default chart format:
Figure 138. The query produces this report for the examples.
+--------------------------------------------------------------------------------+
|       ID  NAME      DEPT   JOB   YEARS  SALARY        COMM                     |
|   ------  --------- ------ ----- ------ ----------  ----------                 |
|      120  NAUGHTON   38    CLERK   -    12954.75      180.00                   |
|      180  ABRAHAMS   38    CLERK   3    12009.75      236.50                   |
|       40  O'BRIEN    38    SALES   6    18006.00      846.55                   |
|       60  QUIGLEY    38    SALES   -    16808.30      650.25                   |
|      130  YAMAGUCHI  42    CLERK   6    10505.90       75.60                   |
|      200  SCOUTTEN   42    CLERK   -    11508.60       84.20                   |
|       90  KOONITZ    42    SALES   6    18001.75     1386.70                   |
|      230  LUNDQUIST  51    CLERK   3    13369.80      189.65                   |
|      250  WHEELER    51    CLERK   6    14460.00      513.30                   |
|      220  SMITH      51    SALES   7    17654.50      992.80                   |
|      150  WILLIAMS   51    SALES   6    19456.50      637.65                   |
+--------------------------------------------------------------------------------+
Or you can enter:
DISPLAY CHART
If you do not specify a chart type, QMF creates the chart by using the GDDM default chart type. The following examples assume that the GDDM default chart type is bar.
To specify a different chart type, enter:
DISPLAY CHART (ICUFORM=charttype
For the QMF-provided chart types, see QMF chart formats.
While the ICU is creating the chart, you see a panel like the one in Figure 139.
Figure 139. The Graphics Bridge Status panel
+--------------------------------------------------------------------------------+
|               GRAPHICS BRIDGE STATUS PANEL                                     |
|                                                                                |
|                                                                                |
|            Your request is currently being processed by the                    |
|               GDDM* Interactive Chart Utility (ICU).                           |
|                                                                                |
|                                                                                |
|                                                                                |
|     When the chart is displayed, you will be within the ICU Environment.       |
|         To return to the QMF environment, press the Exit key.                  |
|                                                                                |
+--------------------------------------------------------------------------------+
The chart displays.
Figure 140. The default bar chart displays.

QMF creates this chart by using the default report form and the default
chart format. You can change the appearance of a chart by changing the
QMF form and by changing the ICU values.