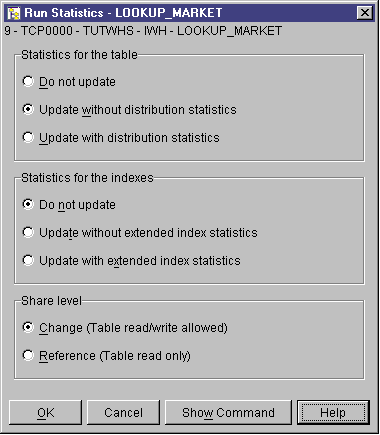
The Run Statistics window opens.

In this lesson, you will learn to define indexes, use the RUNSTATS and REORG utilities, and monitor the warehouse database.
The amount of maintenance that is required for a database is directly related to the amount of database activity or workload. Because this tutorial does not generate significant activity, this lesson is primarily a guide to the DB2 tools and utilities that you can use when you are using an actual warehouse database.
You can create an index to optimize queries for end users of the warehouse. An index is a set of keys, each pointing to a set of rows in a table. The index is a separate object from the table data. The database manager builds the index structure and maintains it automatically. An index gives more efficient access to rows in a table by creating a direct path to the data through the pointers that it creates.
An index is created when you define a primary key or a foreign key. For example, an index was created on the LOOKUP_MARKET table when you defined CITY_ID as its primary key in Lesson 11, Defining keys on target tables.
To create additional indexes:
The Index wizard opens.
Table statistics provide information about the physical and logical characteristics of a table and its indexes. You must periodically collect these statistics, so that DB2 Universal Database can determine the best way to access your data. If extensive changes are made to the data in a table, and the last collection of statistics no longer reflects the actual table data, then data access performance can deteriorate. In general, you should update statistics if there are major changes to the data in your table.
To collect statistics on the LOOKUP_MARKET table:
The Run Statistics window opens.

Reorganizing a table rearranges it in physical storage, eliminating fragmentation and making sure that the table is stored efficiently in the database. You can also use reorganization to control the order in which the rows of a table are stored, usually according to an index.
To reorganize the LOOKUP_MARKET table:
The Reorganize Table window opens.

The performance monitor provides information about the state of DB2 Universal Database and the data that it controls, and calls attention to unusual situations. The information is provided in a series of snapshots, each of which represents the state of the system and its databases at a point in time. You can control the frequency of the snapshots and the amount of information collected by each.
The information that is collected by a performance monitor is returned in performance variables. These performance variables are a defined set of elements that can:
To monitor the LOOKUP_MARKET table:
The Start Monitor window opens.
The Default_for_table_level is an IBM-supplied monitor that is designed to collect key performance related information at the table level.
The Show Monitor notebook opens.
The Details page lists the performance variables that are being collected by the monitor and the values that are returned by the snapshots. The Default_for_table_level monitor takes snapshots (Regular sample box) every 30 seconds, and does not graph its collected data. You can tailor this monitor to your own preferences (for example, graph performance variables or change snapshot interval). See the online help for details.
In this lesson, you created an index. You collected statistics on the LOOKUP_MARKET table, reorganized it, and monitored it. In the next lesson, you will authorize the users of the warehouse database to access the table.