| Note: | As of Version 6, Visual Explain can no longer be invoked from the command line. It can still, however, be invoked from various database objects in the Control Center. For this version, the documentation continues to use the name Visual Explain. |
Overview
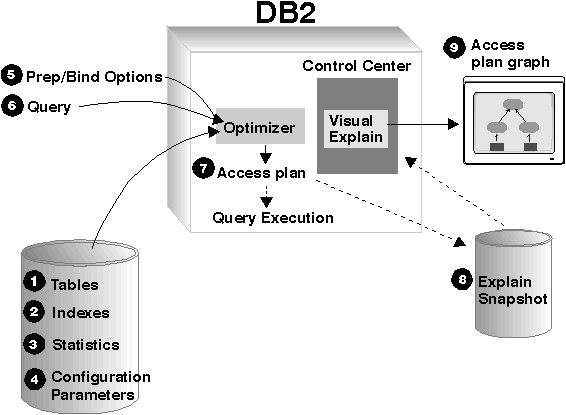
Visual Explain uses information from a number of sources in order to
produce an access plan graph, as shown in the illustration below. Based
on various inputs, the optimizer chooses an access plan, and Visual Explain displays it in an
access plan graph. The nodes in
the graph represent tables and indexes and each operation on them. The
links between the nodes represent the flow of data.

The following list of tasks correspond to those shown in the illustration above. (Broken lines indicate steps that are required for Visual Explain.)
For example, to use Visual Explain, first update current statistics using
the runstats command on the tables, and indexes used by the
statement. These statistics, the configuration parameters, bind
options, and the query itself are used by the optimizer to create an access
plan and an explain snapshot when the package is bound. Visual Explain
uses the resulting explain snapshot to display the access plan graph for the
statement.

The following sections provide an overview of how to use Visual Explain to analyze SQL statements. For detailed information, see the DB2 books that are referenced throughout these sections.
| Note: |
|