Figure 175. Initial Settings for Display Options
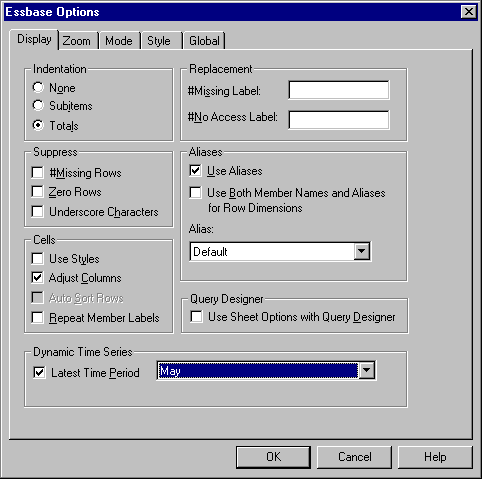 |
Figure 176. Initial Settings for Zoom Options
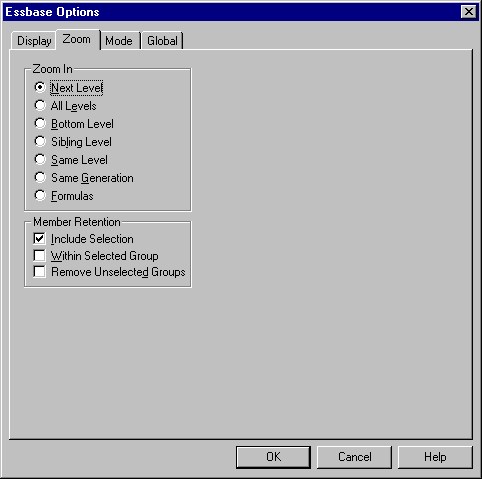 |
Figure 177. Initial Settings for Mode Options
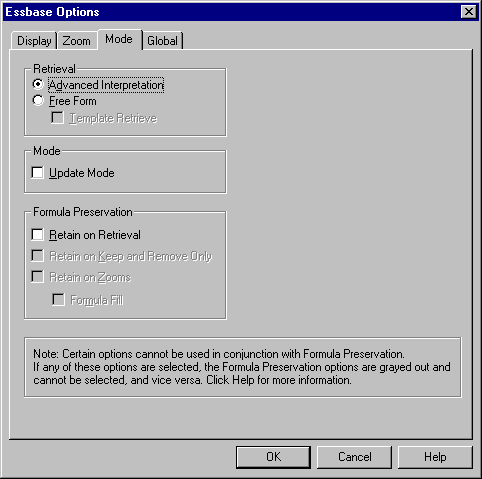 |
Figure 178. Initial Settings for Style Options
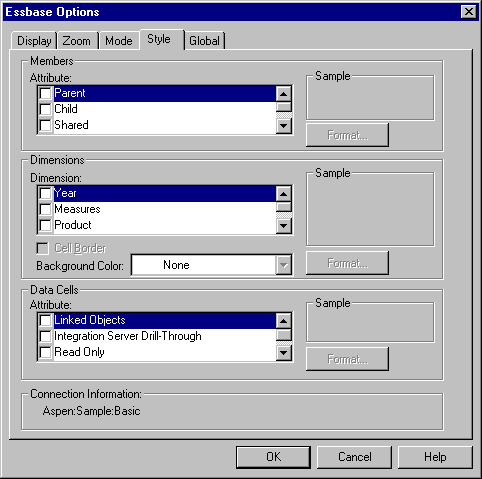 |
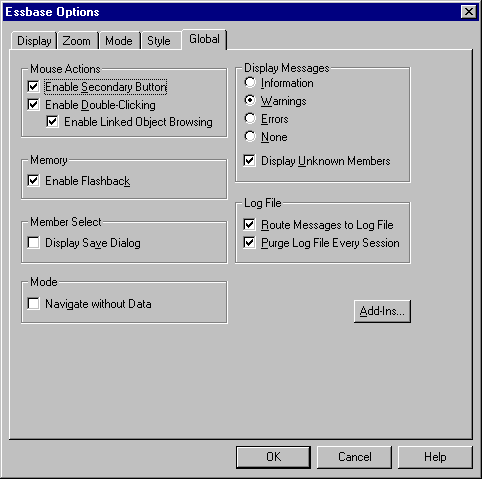
Figure 179. Initial Settings for Global Options
 |
Before starting the tutorial, you should have a working familiarity with the Hyperion Essbase product through the use of the Hyperion Essbase Spreadsheet Add-in interface. As a prerequisite, you should review A Basic Hyperion EssbaseTutorial"Chapter 3. A Basic Hyperion Essbase Tutorial" and An Advanced Hyperion Essbase Tutorial"Chapter 4. An Advanced Hyperion Essbase Tutorial" of this guide.
A sample Hyperion Essbase database is the basis for the examples in this tutorial. The database administrator creates this sample Hyperion Essbase database using the sample metaoutline supplied with Integration Server. For more information, see the Hyperion Integration Server Desktop OLAP Model User's Guide. A sample Excel file, Dtreport.xls, contains a sheet with the appropriate member intersections for the sample Drill-Through report. For more information on the sample database, Excel file, and Drill-Through report, see About the Samples Used in This Tutorial.
If you plan to follow the examples in a live working session, check with the person at your organization who installs the Hyperion Integration Server product family for information on the sample database needed for Drill-Through, and to which Hyperion Essbase server you should connect.
Before starting the tutorial, make sure you meet the following requirements:
The Drill-Through module is installed automatically when you install Hyperion Essbase Spreadsheet Add-in. This module is transparent until you invoke it from the Linked Objects Browser. For more information on installation, contact the Hyperion Essbase System Administrator.
| Note: | For more information on Integration Server installations, see the Hyperion Integration Server Desktop Installation Guide. For more information on Hyperion Essbase installations, see the Hyperion Essbase Installation Guide. |
Keep in mind the following guidelines during the tutorial:
Before you begin the tutorial, make sure that the spreadsheet options are set to the initial settings as illustrated in the following figures. If the option settings are different, the illustrations presented in this chapter may not match the spreadsheet view.
| Note: | For information about each option in the Hyperion Essbase Options dialog box, click Help to see the Hyperion Essbase Spreadsheet Add-in online help. |
Figure 175. Initial Settings for Display Options
 |
Figure 176. Initial Settings for Zoom Options
 |
Figure 177. Initial Settings for Mode Options
 |
Figure 178. Initial Settings for Style Options
 |
Figure 179. Initial Settings for Global Options
 |
The sample database used for this tutorial contains the following dimensions: Scenario, Products, Package, Markets, Accounts, Time, and Channel. The sample Excel file provides a particular view from this database:
Figure 180. View from Sample Database
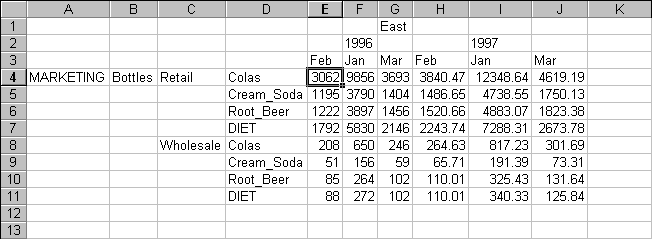 |
For this spreadsheet view, detail-level data exists in a relational data source--data that is not available from Hyperion Essbase. For example, the relational source contains columns of data for cities, seasons, and different types of media (for example, print, radio, and so forth). This tutorial walks you through a sample Integration Server Drill-Through session, where you will drill down from the data shown above into the detail data from the relational source.
This tutorial uses a sample Hyperion Drill-Through report called "Promotion Media Mix for Cities." As with all Hyperion Drill-Through reports, this report has been predefined to retrieve specific columns from the relational source. You will use the Drill-Through Wizard to customize the predefined report.
| Note: | The sample file also contains a second sample report, called "City Demographics," that you can use for Drill-Through practice. |