User's Guide
From the QueryMonitor main window, you can select a specific job and drill
down to view detailed information about that job.
- Select the job that you want to display detailed information for.
| Note: | To select more than one job, press and hold the Shift key while
selecting the jobs.
|
- Right-click on Job Operations. A pop-up menu
opens.
- Select Job Detail.
Detailed job information displays for each selected job in a separate
Detailed Information for Job window similar to the one shown below:

| Note: | You can also double-click a job to display detailed job information for that
job.
|
- Select one of the following tabs to view specific job detail
information:
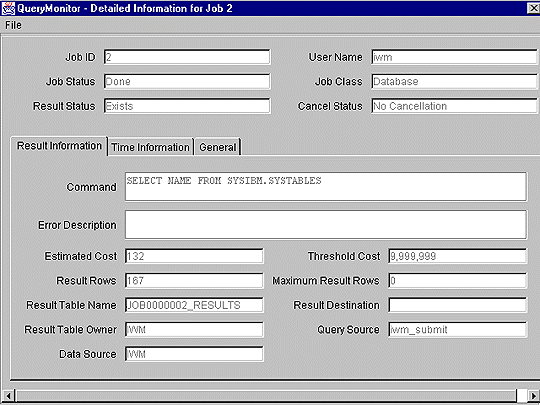
- Result Information
The Result Information page displays the SQL statement, error descriptions,
estimated and threshold costs, and additional result information.
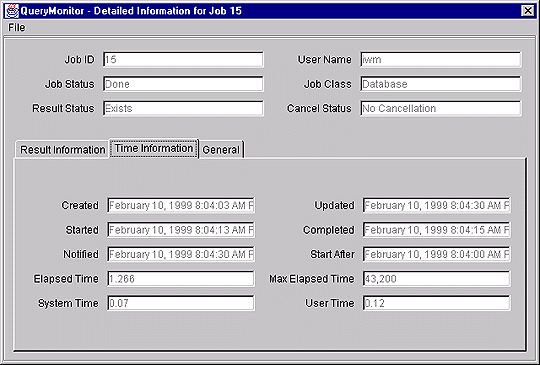
- Time Information
The Time Information page displays the time the job was created, scheduled,
started, updated, and completed. This page also indicates if and when
the user notification was sent.
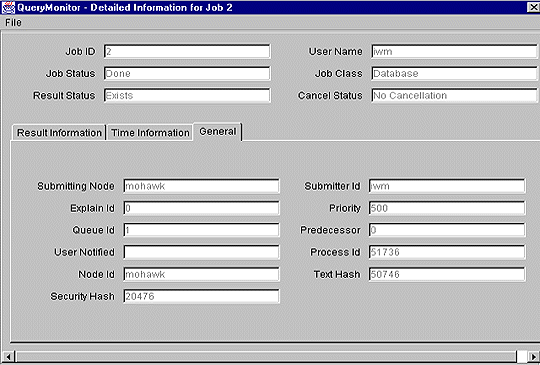
- General
The General page displays the submitting node and ID; job priority and
predecessor, explain ID, queue ID, process ID, node ID, source ID; and
security and text hash values.
The table below contains a description for each field at the top of the
Detailed Information for Job window.
Table 6. Fields Above the Tabs in the Detailed Information for Job Window
| Field
| Description
|
| Job ID
| Contains the user ID.
|
| User Name
| Contains the user name.
|
| Status
|
Indicates the query status. Valid values are:
- estimating
- queued
- held
- scheduled
- running
- done (completed successfully)
- aborted (completed unsuccessfully)
- cancelled
|
| Job
|
Indicates the job type. Valid values are:
- database. Indicates database command
- OS. Indicates operating system command
|
| Result Status
|
Indicates the result status. Valid values are:
- purged due to abort
- truncated
- not existing
- exists
- dropped
|
| Cancellation Status
|
Indicates the status of any cancellation requested for this job.
Valid values are:
- no cancellation - no cancellation has been requested
- cancellation requested - cancellation was requested but not yet accepted
- cancellation accepted - cancellation accepted by DB2 Query Patroller
|
To view result information, click the Result Information tab on the
Detailed Information for Job window. The Result Information page is
illustrated below:

The table below contains a description of each field on the Result
Information page.
Table 7. Fields on the Result Information Tab
| Field
| Description
|
| Command
| Contains the SQL command.
|
| Error Description
| Indicates the reason the job was put on hold or aborted.
|
| Estimated Cost
| Indicates the estimated database cost.
|
| Threshold Cost
| Indicates the user's threshold cost.
|
| Result Rows
| Indicates the number of rows returned in the result set.
|
| Max Result Rows
| Indicates the user's threshold for the maximum number of rows in a
result set.
|
| Result Table Name
| Contains the name of the result table.
|
| Result Destination
| Contains the name of the alternate result destination.
|
| Result Table Owner
| Contains the name of the result table owner.
|
| Query Source
| Indicates the application that created the job.
|
| Data Source
| Indicates the data source against which the query was run.
|
To view time information, click the Time Information tab on the
Detailed Job Information window. The Time Information page is
illustrated below:

The table below contains a description of each field on the Time
Information page.
Table 8. Fields on the Time Information Page
| Field
| Description
|
| Created
| Indicates the date and time the query was created.
|
| Updated
| Indicates the date and time the query was updated, if applicable.
|
| Started
| Indicates the date and time the query began execution, when
applicable.
|
| Completed
| Indicates the date and time the query completed, if applicable.
|
| Notified
| Indicates the date and time the user notification of query completion was
sent, if applicable.
|
| Start After
| Indicates the date and time after which the job can be scheduled for
execution.
|
| Elapsed Time
| Displays the number of seconds it took the job to run.
|
| Max Elapsed Time
| Indicates the maximum number of seconds allowed for the job run
time.
|
| System Time
| Indicates the system CPU time in seconds that were used to run this
job.
|
| User Time
| Indicates the user CPU time in seconds that were used to run this
job.
|
To view general information, click the General tab on the Detailed
Information for Job window. The General page is illustrated
below:

The table below contains a description of each field on the General
page.
Table 9. Fields on the General Page
| Field
| Description
|
| Submitting Node
| Contains the name of the node from which the query was submitted.
|
| Submitter ID
| Contains the ID of the user who submitted the job.
|
| Explain ID
| Contains the ID of the SQL statement in the explain cache.
|
| Priority
| Displays the priority level for the query.
|
| Queue ID
| Indicates the job queue ID.
|
| Predecessor
| Identifies which job must complete successfully before this job can be
scheduled for execution.
|
| User Notified
| Indicates whether or not the user was notified of query
completion. Valid values are Yes or No.
|
| Process ID
| Contains the process ID of the executor component.
|
| Node ID
| Contains the node ID on which the job was executed.
|
| Text Hash
| Contains a hash value used to limit the number of rows scanned to find a
specific SQL statement.
|
| Security Hash
| Contains the hash value used to ensure that job data is not
modified.
|
To refresh the Detailed Job Information window with the most current
information, select Refresh from the File menu.
To close the Detailed Information for Job window, select Close from
the File menu, or close the window.
[ Top of Page | Previous Page | Next Page | Table of Contents | Index ]
[ DB2 List of Books |
Search the DB2 Books ]
