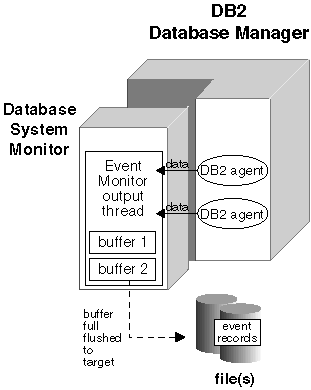

The event monitor output thread buffers records, using two internal buffers, before writing them to disk. Records are written to the trace only when a buffer is full. To force an event monitor to flush its buffers you must turn it off or empty the buffers using the FLUSH EVENT MONITOR command. The size of these buffers can be specified on the CREATE EVENT MONITOR statement with the BUFFERSIZE argument. Specifying larger buffers reduces the number of disk accesses and for event monitors with a high amount of throughput, improves monitoring performance.
Figure 4 illustrates how event records are generated for a FILE statement event monitor: 2 applications are connected to a database, each having a single agent working on its behalf.
Figure 4. Event Monitor Buffers
 |
In this example, each application agent has just finished executing a statement and is reporting the monitor data it has collected for its statement to the event monitor output thread. The output thread formats the records and writes them into one of its two buffers. The buffer gets written to a file when it is full. Having two buffers allows the output thread to continue receiving data from database agents, while a buffer is being written.
A blocked event monitor will suspend the agent(s) sending monitor data, when both of its buffers are full, until a buffer has been written. This can introduce a significant performance overhead, depending on the type of workload and the speed of the I/O device. But, a blocked event monitor never discards event records, as long as it is running. This is the default.
A non-blocked event monitor will simply discard monitor data coming from the agents when the data is coming faster than it can write it. This allows event monitoring with less impact on other database activities. The following is sample DDL for creating a non-blocked event monitor:
 |
An event monitor that has discarded event records generates an overflow event. It specifies the start and stop time during which the monitor was discarding events, and the number of events that were discarded during that period.
It is possible for an event monitor to terminate or be deactivated with a pending overflow to report. If this occurs, the following message is written to the db2diag.log:
     DIA1603I Event Monitor monitor-name had a pending overflow
     record when it was deactivated.
All the output of the event monitor goes in the directory supplied to the FILE argument on the CREATE EVENT MONITOR statement.
When a file event monitor is first activated, a control file is created in this directory. This binary file contains control information that is used to prevent two event monitors from simultaneously writing to the same target, and to keep track of the file and file location where the event monitor is supposed to write its next record. It is named db2event.ctl; do not remove or modify this file.
By default, an event monitor writes its trace to a single file, called 00000000.evt. This file will keep growing as long as there is space on the file system. You can limit the maximum size of a trace using the MAXFILESIZE and MAXFILES arguments of the create event monitor statement.
The trace produced by an event monitor can be quite large, and you may want to break it down into several files of a fixed size. This also allows you to remove files after processing them, while the event monitor is still running.
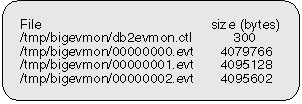
Files are numbered sequentially, beginning with 00000000.evt. If you are using several files, then when a file is full, output is automatically directed to the next file. For example, the following event monitor will break down its trace into 4MB files. It keeps creating files as long as there is space on the file system.
 |
This might result in the following files in its target directory.
 |
The highest numbered file is always the active file. When the number of files reaches the maximum defined by MAXFILES, the event monitor deactivates itself and the following message is written to the DB2DIAG.LOG.
     DIA1601I Event Monitor monitor-name was deactivated when
     it reached its preset MAXFILES and MAXFILESIZE limit
You can avoid this situation by removing full files (see Processing Data While Monitor is Active). Any event file except the active file can be removed while the event monitor is still running.
When a File event monitor runs out of disk space, it shuts itself down, after logging a system-error-level message in the error logs, db2diag.log and db2err.log.
You may want an event monitor to collect data continuously so that no events are ever missed. For example, if you have a usage account system that uses an event monitor to collect data, you may want to process the data each night beginning at 2:00 AM, at which point you delete the files that have been processed.
An event monitor cannot be forced to switch to the next file unless you stop and restart it. It must also be in APPEND mode. In order to keep track of which events have been processed in the active file, you can create an application that simply keeps track of the file number and location of the last record processed. When processing the trace the next time around, the application can simply seek to that file location.
Using Pipe event monitors is an easy way to read data produced by an active event monitor (see Using Pipe Event Monitors).
When a File event monitor is restarted, it can either erase any existing data, or append to it.
An APPEND event monitor starts writing at the end of the file it was last using (the file number is indicated in the db2evmon.ctl control file). If you have removed that file, then the next file number in sequence is used. For example, in the example above, if you remove all .evt files, and restart the event monitor, then event records will be written into 00000003.evt. If you had not removed the files, then they would go into or append to 00000002.evt. When an append event monitor is restarted, only the start_event is generated. The event log header and database header are only generated for the first activation.
A REPLACE event monitor always deletes existing event files, and starts writing at 00000000.evt.