
In contrast to taking a point in time snapshot, an event monitor writes out database system monitor data to either a file or a named pipe, when one of the following events occurs:
An event monitor effectively provides the ability to obtain a trace of the activity on a database.
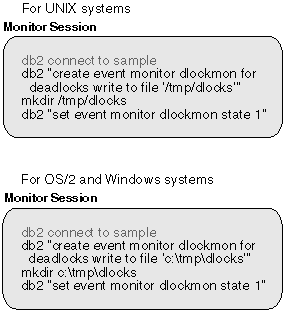
For example, you can request that DB2 logs the occurrence of deadlocks between connections to a database. First, you must create and activate a DEADLOCK event monitor:
 |
Now, two applications using the database enter a deadlock. That is, each one is holding a lock that the other one needs in order to continue processing. The deadlock is eventually detected and resolved by the DB2 deadlock detector component, which will rollback one of the transactions. The following figures illustrate this scenario.
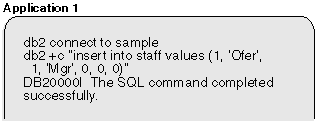 |
| Note: | The +c option turns autocommit off for CLP. |
Application 1 is now holding an exclusive lock on a row of the staff table.
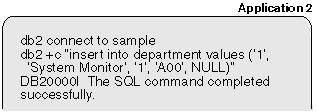 |
Application 2 now has an exclusive lock on a row of the department table.
 |
Assuming cursor stability, Application 1 needs a share lock on each row of the department table as the rows are fetched, but a lock on the last row cannot be obtained because Application 2 has an exclusive lock on it. Application 1 enters a LOCK WAIT state, while it waits for the lock to be released.
 |
Application 2 also enters a LOCK WAIT state, while waiting for Application 1 to release its exclusive lock on the last row of the staff table.
These applications are now in a deadlock. This waiting will never be resolved because each application is holding a resource that the other one needs to continue. Eventually, the deadlock detector checks for deadlocks (see the dlchktime database manager configuration parameter in the Administration Guide) and chooses a victim to rollback:
 |
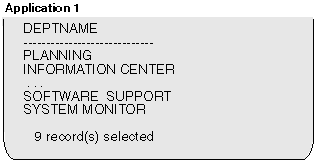
At this point the event monitor logs a deadlock event to its target. Application 1 can now continue:
 |
Because an event monitor buffers its output and this scenario did not generate enough event records to fill a buffer, the event monitor values are forced to the event monitor output writer:
 |
The event trace is written as a binary file. It that can now be formatted using the db2evmon tool:
 |
This will format and print to stdout, a trace similar to the following:
--------------------------------------------------------------------------
                            EVENT LOG HEADER
  Event Monitor name: DLOCKMON
  Server Product ID: SQL05000
  Version of event monitor data: 6
  Byte order: BIG ENDIAN
  Number of nodes in db2 instance: 1
  Codepage of database: 850
  Country code of database: 1
  Server instance name: bourbon
--------------------------------------------------------------------------

--------------------------------------------------------------------------
  Database Name: SAMPLE
  Database Path: /home/bourbon/bourbon/NODE0000/SQL00002/
  First connection timestamp: 06-03-1997 13:31:13.607548
  Event Monitor Start time:   06-03-1997 13:32:11.676071
--------------------------------------------------------------------------

3) Connection Header Event ...
  Appl Handle: 0
  Appl Id: *LOCAL.bourbon.970603173114                     - Monitor session
  Appl Seq number: 0001
  DRDA AS Correlation Token: *LOCAL.bourbon.970603173113
  Program Name    : db2bp_32
  Authorization Id: BOURBON
  Execution Id    : bourbon
  Codepage Id: 850
  Country code: 1
  Client Process Id: 63590
  Client Database Alias: sample
  Client Product Id: SQL05000
  Client Platform: AIX
  Client Communication Protocol: Local
  Client Network Name:
  Connect timestamp: 06-03-1997 13:31:13.607548

4) Connection Header Event ...
  Appl Handle: 1                                          - Application 1
  Appl Id: *LOCAL.bourbon.970603173330
  Appl Seq number: 0001
  DRDA AS Correlation Token: *LOCAL.bourbon.970603173329
  Program Name    : db2bp_32
  Authorization Id: BOURBON
  Execution Id    : bourbon
  Codepage Id: 850
  Country code: 1
  Client Process Id: 119710
  Client Database Alias: sample
  Client Product Id: SQL05000
  Client Platform: AIX
  Client Communication Protocol: Local
  Client Network Name:
  Connect timestamp: 06-03-1997 13:33:29.518568

5) Connection Header Event ...
  Appl Handle: 2
  Appl Id: *LOCAL.bourbon.970603173409                   - Application 2
  Appl Seq number: 0001
  DRDA AS Correlation Token: *LOCAL.bourbon.970603173408
  Program Name    : db2bp_32
  Authorization Id: BOURBON
  Execution Id    : bourbon
  Codepage Id: 850
  Country code: 1
  Client Process Id: 33984
  Client Database Alias: sample
  Client Product Id: SQL05000
  Client Platform: AIX
  Client Communication Protocol: Local
  Client Network Name:
  Connect timestamp: 06-03-1997 13:34:08.972643

6) Deadlock Event ...
  Number of applications deadlocked: 2                  - Deadlock
  Deadlock detection time: 06-03-1997 13:36:48.817786
  Rolled back Appl Id: : *LOCAL.bourbon.970603173409
  Rolled back Appl seq number: : 0001

7) Deadlocked Connection ...
  Appl Id: *LOCAL.bourbon.970603173409
  Appl Seq number: 0001
  Appl Id of connection holding the lock: *LOCAL.bourbon.970603173330
  Seq. no. of connection holding the lock:
  Lock wait start time: 06-03-1997 13:36:43.251687
  Deadlock detection time: 06-03-1997 13:36:48.817786
  Table of lock waited on      : STAFF
  Schema of lock waited on     : BOURBON
  Tablespace of lock waited on : USERSPACE1
  Type of lock: Row
  Mode of lock: X
  Lock object name: 39

8) Deadlocked Connection ...
  Appl Id: *LOCAL.bourbon.970603173330
  Appl Seq number: 0001
  Appl Id of connection holding the lock: *LOCAL.bourbon.970603173409
  Seq. no. of connection holding the lock:
  Lock wait start time: 06-03-1997 13:35:32.227521
  Deadlock detection time: 06-03-1997 13:36:48.817786
  Table of lock waited on      : DEPARTMENT
  Schema of lock waited on     : BOURBON
  Tablespace of lock waited on : USERSPACE1
  Type of lock: Row
  Mode of lock: X
  Lock object name: 15
This event monitor trace shows that there was 1 application connected to the database when the event monitor was activated. This is indicated by the first Connection Header Event record in the output (record number 3). A Connection Event Header is generated for each active connection when an event monitor is turned on, and for each subsequent connection, once it becomes active. The other two Connection Headers, (records 4 and 5) were generated when the two applications connected.
The trace also shows that a deadlock occurred (record number 6). It shows which locks on which tables caused this deadlock (record numbers 7 and 8), and which application the deadlock detector chose to roll back (record number 6).
The db2eva graphical tool can also be used for formatting a trace. It is particularly useful for handling file traces that are too large to be read with db2evmon. It displays collected information in a tabular format. It includes a number of different view options, which allows you to filter unwanted records and drill down to the periods of interest in the trace. For instance, you can decide to display only the transaction events for a given connection. It also allows you to view the statement text for static SQL that it automatically fetches from the DB catalog (the text is only available for dynamic SQL in the event monitor trace).
You can invoke this tool with the db2eva command (see the Command Reference).
| Note: | The files must be available on the machine where you invoked db2eva. |
The db2eva tool is available on OS/2 and Windows systems.
To define and use an event monitor on a database, you must have at least DBADM authority on that database.
As illustrated in the sample scenario, collecting system monitor data with an event monitor is a three step process:
Specify the events to be monitored. An event monitor is created and activated by using SQL statements. Unlike snapshot monitoring, where data can be collected at the database manager level, an event monitor only gathers data for a single database.
Creating an event monitor stores its definition in the event monitor database system catalogs:
It is necessary to connect to the database when defining an event monitor.
Activating an event monitor starts a process or thread, which records monitor data to either a named pipe or a file as events occur. You may want an event monitor to be activated as soon as the database is started, so that all activity is monitored from start-up. This can be done by creating an AUTOSTART event monitor:
 |
This event monitor will be automatically started every time the database is activated, either by using the ACTIVATE DATABASE command, or when the first application connects. Note that creating an AUTOSTART event monitor does not activate it. This event monitor will be activated the next time the database is stopped and re-activated. An event monitor that has not been automatically started must be manually started:
 |
All event monitors for a database are stopped when the database is deactivated.
Reading a trace can be done using the db2evmon applet, or by writing your own application (see Chapter 4. Event Monitor Output). The Control Center and Event Analyzer (parts of the DB2 GUI) can be used to create and activate event monitors, and to read the traces produced by FILE event monitors.
Figure 2 illustrates the process and interface for using event monitors.
Figure 2. Event Monitoring Interfaces
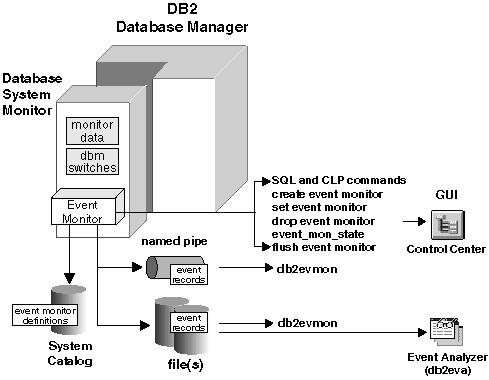 |
As illustrated in Figure 2, event monitors are created and manipulated using the following SQL statements:
You can determine if an event monitor is active by using the SQL function EVENT_MON_STATE:
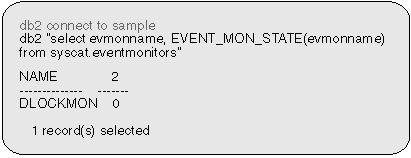 |
A returned value of 0 indicates that the event monitor is inactive.
Event monitors return information that is similar to the information available using the snapshot API. In these cases, it is an event that controls when the snapshot is taken. For example, a connection event monitor basically takes an application snapshot just before the connection is terminated.
When you define an event monitor you must declare the event types that will
be monitored. The following table lists the event types supported and
indicates the information returned. Note: an event
monitor can be defined for more than one event type.
| Event type | When data is collected | Information returned |
|---|---|---|
| Deadlock | Detection of a deadlock | The applications involved and locks in contention. |
| Statements | End of SQL statement | Statement start/stop time, CPU used, text of dynamic SQL, SQLCA (return code of SQL statement), and other metrics such as fetch count. |
| End of subsection | For partitioned databases: CPU consumed, execution time, table and tablequeue information. | |
| Transactions | End of unit of work | Unit of work start/stop time, previous UOW time, CPU consumed, locking and logging metrics. |
| Connections | End of connection | All application level counters. |
| Database | Database deactivation or last connect reset | All database level counters. |
| Buffer pools | Counters for buffer pool, prefetchers, page cleaners and direct I/O for each buffer pool. | |
| Table spaces | Counters for buffer pool, prefetchers, page cleaners and direct I/O for each table space. | |
| Tables | Rows read/written for each table. |
| Note: | In addition to the above information, all event monitors trace the establishment of connections to the database, by generating a connection header record for each active connection when the event monitor is turned ON, and for each subsequent connection, thereafter. |
See Output Records for a list of the records generated for each event type.
A pipe event monitor allows you to process event records in real time. Another important advantage to using pipe event monitors is that your application can ignore unwanted data as it reads it off the pipe, giving the opportunity to considerably reduce storage requirements. It also allows an application to store event monitor data, in real-time, into an SQL database.
When you direct data to a pipe, I/O is always blocked and the only buffering is that performed by the pipe. It is the responsibility of the monitoring application to promptly read the data from the pipe as the event monitor writes the event data. If the event monitor is unable to write the data to the pipe (for example, because the pipe is full), monitor data will be lost.
The steps for using pipe event monitors are essentially the same on all operating systems. However, implementation can be different. The following section describes the basic steps, and highlights the differences between UNIX based systems, Windows NT, and OS/2.
      db2 connect to sample
    On AIX, and other UNIX platforms:
      db2 create event monitor STMT2 for statements
          write to PIPE '/tmp/evmpipe1'
    On Windows NT:
      db2 create event monitor STMT2 for statements
          write to PIPE '\\.\pipe\evmpipe1'
    On OS/2:
      db2 create event monitor STMT2 for statements
          write to PIPE '\pipe\evmpipe1'
In UNIX (this includes AIX environments), use the mkfifo() function or mkfifo command. In OS/2, use the DosCreateNPipe() function. In Windows NT, use the CreateNamedPipe() function. The pipe name must be the same as the target path specified on the CREATE EVENT MONITOR statement.
In UNIX, use the open() function. In OS/2, use the DosConnectNPipe() function. In Windows NT, use the ConnectNamedPipe() function.
You can also use the db2evmon application, specifying the database and pipe name, for example:
db2evmon -db sample -evm STMT2
This will open the named pipe and wait for the event monitor to write to it.
If the event monitor is started automatically, you do not need to take any specific action to start it unless the database is already active (however, the pipe must already be opened).
db2 set event monitor stmt2 state 1
In UNIX, use the read() function. In OS/2, use the DosRead() function. In Windows NT, use the ReadFile() function. Your application may stop reading data from the pipe at any time. When it reads an EOF, there is no more monitor data. See Chapter 4. Event Monitor Output for how to read the event monitor data.
db2 set event monitor stmt2 state 0
This statement can be used to stop any event monitor, even one that was started automatically. If you do not explicitly stop an event monitor, it will be stopped when:
In UNIX, use the close() function. In OS/2, use the DosDisConnectNPipe() function. In Windows NT, use the DisconnectNamedPipe() function.
In UNIX, use the unlink() function. In OS/2, use the DosClose() function. In Windows NT, use the CloseHandle() function.
For UNIX-based operating systems, named pipes are like files, so you do not have to delete them and create them again before each use.
In addition, there must be enough space in the named pipe. If the application does not read the data fast enough from the named pipe, the pipe will fill up and overflow. Pipe overflows can also occur on platforms (such as OS/2) where the creator of the pipe can define the size of the named pipe buffer. The smaller the buffer, the greater the chance of an overflow occurring. When a pipe overflow occurs, the monitor creates overflow event records indicating that an overflow has occurred. The event monitor is not turned off, but monitor data is lost. If there are outstanding overflow event records when the monitor is deactivated, a diagnostic message will be logged. Otherwise, the overflow event records will be written to the pipe when possible.
If your operating system allows you to define the size of the pipe buffer, use a pipe buffer of at least 32K. For high-volume event monitors, you should set the monitoring application's process priority equal to or higher (lower nice value on AIX) than the agent process priority (see the section on Priority of Agents in the Administration Guide).