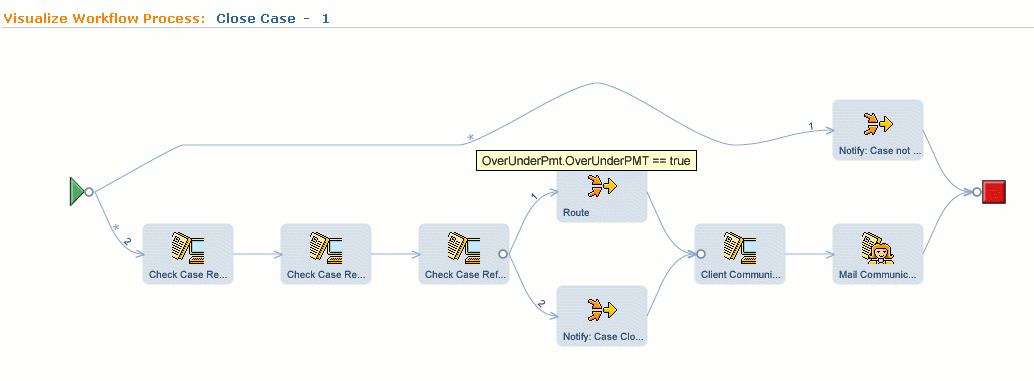
A read-only graphical utility is provided as part of the Process Definition Tool which enables process administrators to visualize processes as they are being created or modified. This tool allows administrators view all activities and transitions in a process definition and provides a high level view of all the possible paths through the workflow process during execution. An example of a graphical representation of a workflow process definition is shown below.

The visualized process comprises a number of nodes on a graph representing the activities in the process. The nodes are linked by graph edges and these reflect the transitions defined in the process definition. Clicking on an activity in the graph displays the details of the activity in the PDT. Similarly, clicking on a transition between activities on the graph displays the details of the transition in the PDT.
The graphical tool displays the following information for each process visualized:
- The type and name of each activity. Each activity type is identified by a specific icon.
- The notifications defined for each activity (See Activity Notifications). If an activity has an associated notification, it will be represented as an envelope which is click-able through to the associated activity notification page.
- The split/join type (See Split/Join) for each activity. A split or join type of "choice" on an activity is represented as a circle, while a split or join type of "parallel" is represented as a square.
- The transitions between activities. Where a transition between activities has an associated transition condition (See Conditions), this is represented as an asterisk. The details of the condition are displayed when the mouse is placed over that asterisk.
- The ordering of each choice split (See Split/Join) from an activity. As the ordering of a choice split from an activity is important (the first eligible transition in the list will be followed), the order of each transition from the activity is displayed as a number on that transition.