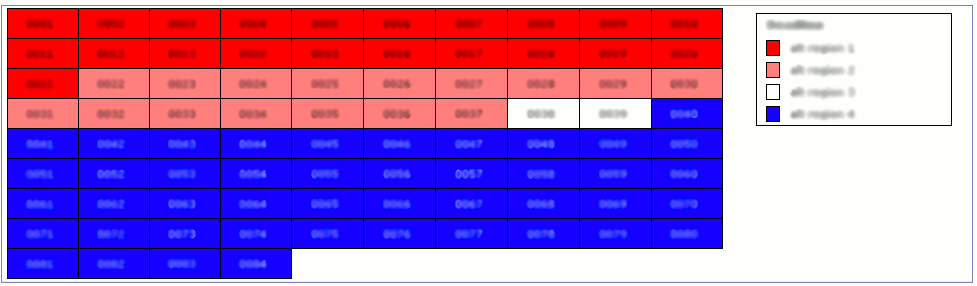
The Heatmap widget is a control which displays a grid of items of different importance. Items in the widget are presented by color shades varying from red to blue, indicating their importance level from highest to lowest.
The widget is inserted into the page when the XML_HEATMAP domain is associated with UIM source property of a FIELD.
The Heatmap widget expects XML data from the server in the following format:
<HEATMAP>
  <REGION REGION_ID="R1" LABEL="highest importance"/>
  <REGION REGION_ID="R2" LABEL="middle importance">
    <ITEM ITEM_ID="id9" LABEL="0009" />
    <ITEM ITEM_ID="id10" LABEL="0010"/>
    <ITEM ITEM_ID="id21" LABEL="0021"/>
  </REGION>
  <REGION REGION_ID="R3" LABEL="lowest importance">
    <ITEM ITEM_ID="id22" LABEL="0022"/>
  </REGION>
  ...
</HEATMAP>
Here, the REGION elements specify the importance level ("heat") of their contained ITEM s. There should be at least two regions in a heatmap widget. The color will always start from red, so if no items of that importance are there, empty REGION elements should be inserted for the widget to render properly.
The following image shows an example of the Heatmap widget.