Becoming a performance
engineer
with Quantify
Dr. Telemachos F. Stephani of the Institute
of Mediterranean Antiquity in Silicon Isle, Greece, has announced the imminent
completion of his controversial project of teaching a computer to reproduce
the authentic sounds of ancient Homeric epic song, last heard over 2,500
years ago. Stephani, who bases his work on an exhaustive database of historical
phonetic changes, reported today that he is "ready to summon up the virtual
spirit of Homer to sing again, just as soon as I resolve some performance
bottlenecks in the code."
--Silicon Isle Herald, July 12
The crunch
is on
I must have been out of my mind, announcing "imminent completion"
of my Homer simulator. All the components are in place, but the code is
just too slow for a realistic reproduction of speech. I've got to find
out why the code bogs down, or Homer will sound like he's mumbling in his
sleep.
I should have used Quantify to speed up this code weeks ago. I'll
grab the laptop, and head down to the Old Cybercafe for a change of scenery.
Great place, this--ouzo, snacks, and . . . oh, good! There's Nausikaa,
the programmer from the new start-up next door . . .
"Yassou, Nausikaa!"
"Hello Telemachos! How's the Homerophone? I just
read about it in the Herald."
"I'm running a tool called Quantify now to profile the entire project,
looking for performance bottlenecks. Here, I'll show you."
Get
the big picture first
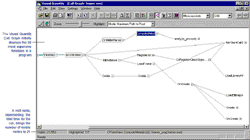
"Quantify starts out with a Call Graph, which
focuses on the heavy-duty components of my code, the areas where any performance
improvement would make the biggest impact."
click
to enlarge
"And -- eureka! We've found something big on
the first try. See this ComputeMeter
function?

It's the starting point for my routine that calculates the poetic meter
of each line of verse. It works with the speech-generation module at the
output end of the process, and if it's slow it could bog down the recitation--a
deadly place for a performance bottleneck. That function should
be so fast that it wouldn't show up on this Call Graph at all."
"Okay, Telemachos. But where does this take
us? I see only one function that ComputeMeter
calls. Where does the program go from here?"
Focus!
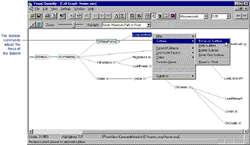
"Watch this, Nausikaa. First we isolate the
suspicious functions."
click
to enlarge
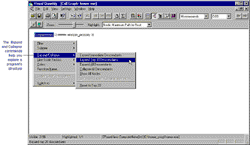
Quantify adjusts the dataset so it contains only ComputeMeter
and its descendants. Now we can expand the ComputeMeter
subtree to see what's going on downstream.
click
to enlarge
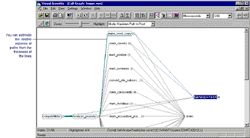
Quantify displays the most time-consuming descendants of ComputeMeter.
Look at this, Nausikaa! The most expensive paths in the subtree lead to
the SetWindowTextA function.
click
to enlarge
"But Telemachos, what is your program doing
with any window text at all? It's the audio output that counts. Or does
the window text function serve a purpose?"
"Well, it used to serve a purpose. I
originally put that function in to give me feedback when I was developing
the algorithm. I must have missed some of its callers when I was cleaning
up the code. That's the kind of thing that happens when you're under pressure,
isn't it?"
Just
how much is this costing?
"Anyway, let's get some solid numerical data
and see exactly how much time those leftover SetWindowTextA
calls are costing me.

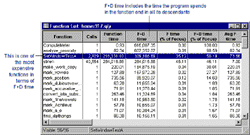
"Here's all the data for the subtree.
click
to enlarge
"Look at the percentages. SetWindowTextA
takes up 50% of the subtree's total time. A classic example of unnecessary
processing, a classic bottleneck."
"Code bloat, Telemachos, and from you! But I'm
impressed with the way Quantify starts by orienting you in your program,
then helps you zero in on the problem."
Doing
interactive "what-ifs"
"It's even better than that, Nausikaa. You can
use Quantify to project performance improvements. Look what happens if
I right-click SetWindowTextA
in the Call Graph and then delete the SetWindowTextA
subtree.
"Quantify discards the subtree's time from the
dataset and recomputes the remaining data so that I can see exactly how
the program will perform without the subtree.
"Now, let's see how the change shows up in the
Function List.
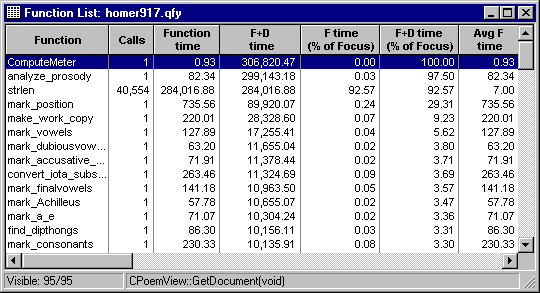
"Great! The time for the ComputeMeter
subtree, which took over 615,000 microseconds before I made the change,
is now just over 306,000 microseconds. This major subtree's performance
is really improved."
"Move over a minute, Telemachos, and let me
navigate a bit. I noticed that the strlen
function is showing up both in the Function List and the Call Graph. In
fact, the Function List shows this run of your program called it over 40,000
times."
A
suspiciously prominent function
"And look at the Call Graph, Telemachos. All
the expensive functions in this part of the application call strlen.
Why is that?"
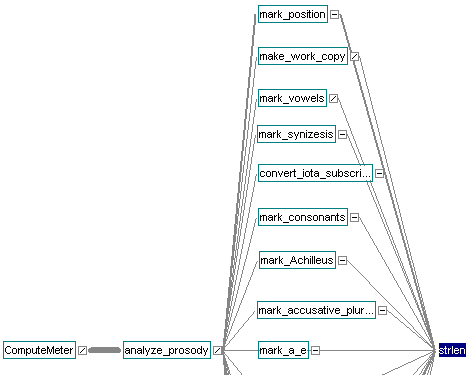
"This part of the code manipulates lines of
Homer as strings. These functions apply an enormous collection of complex
metrical rules to each line sequentially. They determine the rhythmical
pattern of each verse, just before the `Homerophone,' as you call it, chants
it."
"But even so, Telemachos, it seems odd to call
strlen so many times.
Here, I'll sort the Function List by function time.

click
to enlarge
"See? By itself, strlen
uses around 92% of the total subtree time, now that we've discarded SetWindowTextA.
That seems excessive."
Examining
the details
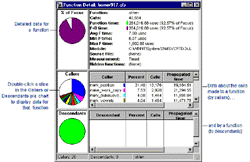
"If you open the Function Detail window, Nausikaa,
we can get a different angle on the data for strlen:
specific information, in numerical and graphical format, about calls to
it from other functions."

click
to enlarge
"It's interesting that most of the functions
make about the same number of calls to strlen.
And quite a few calls, too. I think I know what's going on. Can we look
at your source code to see exactly what it's doing?"
Getting
right to the source
"Nothing easier, Nausikaa--the code's even annotated with line-by-line
performance data. Here's the code for mark_consonants,
one of the functions that call strlen.


click
to enlarge
"Look at the data for the for
statement. Its line + descendants time is much greater than its line time
alone, which means the line calls other functions heavily. The only part
of the line that could possibly represent a function call is i<SPECIMEN_LENGTH(specimen).
And sure enough, checking the macros, I see that I #define
SPECIMEN_LENGTH as a call to strlen.
In effect, the program is calling strlen
every time it traverses one of these loops. And it's the same for all these
other functions, too.
"What a waste of time! All I really need to
do is call strlen once
for each verse, then cache the value. A case of unnecessary recomputation,
another textbook example of a performance bottleneck. Why, I could write
a performance engineering manual based on what I'm learning!"
Now,
let's fix it and compare
"Let me make some global fixes in my code to
get rid of all these strlen
calls, and run the program again."

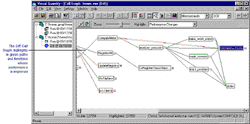
"Now let's compare the first run to the new
run, to see how the performance has improved."
click
to enlarge
"Good. The Diff Call Graph highlights ComputeMeter,
strlen, and SetWindowTextA
in green, meaning their performance is improved. I'll open the Diff Function
List to get the numerical comparison."

click
to enlarge
"Fantastic! The total time for ComputeMeter
is now around 14,000 microseconds. That's an improvement of more than 600,000
microseconds! This code's going to sizzle! Rise up, Homer, and sing your
heart out! We're back on track!"
"Great job, Telemachos! The Homerophone is really
going to perform now, thanks to Quantify. And speaking of performance,
our company team is challenging the Institute to a game of soccer. You've
got some spare time now--care to come along?"
Back | Next
| Table of contents
|