Getting startedWith
Purify, you can deliver cleaner code in a few easy steps: This chapter shows you how to use Purify in Microsoft Developer Studio
97 or later. But you can also use Purify independently of Developer Studio. Read "Using Purify standalone"and "Testing with Purify's command-line interface." Open your project in Developer Studio, then engage Purify from the
Purify toolbar. Set Purify to collect coverage data, as well as checking for errors and memory leaks. Build and execute your program using commands from the Developer Studio Build
menu. (To get the maximum level of detail in Purify error reports, build your program with
debug and relocation data.) Purify copies the program and each library it calls, then instruments the copies using Object Code Insertion (OCI) technology. The instrumentation process inserts instructions that validate every read, write, and allocation and deallocation of memory. If you're collecting coverage data, Purify also inserts instructions that increment counters when you exercise specific lines and functions. Purify reports its progress as it instruments each module. Purify instruments each module at a default instrumentation level, but you can customize the instrumentation level to provide more or less detail for special cases. More information? For an explanation of instrumentation levels and how to use them, read "Customizing instrumentation". For more detail, look up instrumenting in the Purify online Help index.Purify caches the instrumented version of each module. When you rerun a program, Purify saves time and resources by using the cached modules, re-instrumenting only those that have changed since the previous run. As you exercise your program, Purify detects run -time errors and memory leaks and displays them in an Error View tab in the Purify Data Browser window.More information? Look up error view in the Purify online Help index. Note: If you're debugging client/server and multi-process applications, you can debug several processes and see the error reports for each running application simultaneously. To do this, run each process in a separate instance of Developer Studio with Purify engaged. Alternatively, you can use the standalone Purify user interface. See "Using Purify standalone". Seeing all your errors at a glance Purify displays error and warning messages about run-time errors and memory leaks, and informational messages about the progress of your program's execution.When you exit the program, Purify reports memory leaks. In addition to memory leaks, you can set Purify to report memory in use at exit and handles in use at exit. More information? Look up error and leak settings in the Purify
online Help index. More information? If you want Purify to display each occurrence of a message individually, instead of reporting counts, you can change the default setting. Look up error and leak settings in the online Help index.
You can filter messages individually, or you can filter
them based on their type and source. Consider hiding all
informational messages, for example, or all messages originating
from a specific file. Once created, error filters apply to the current run and to all future runs of the program until you disable them. Disabling a filter causes hidden messages to be redisplayed in the error view.
Purify filters are very flexible. Click the Filter Manager tool
In addition to filtering, you can also use Purify's PowerCheck feature to focus on specific modules and simultaneously minimize instrumentation time. For information about the PowerCheck feature, read "Customizing instrumentation" . Here's an example of an expanded ABW (array bounds write)
error message: The level of detail provided in call stacks depends on the availability of debug and relocation data. Even if you build your program in release mode, you can still get the highest possible level of detail. For more information, look up debug data, doing data, release builds in the Purify online Help index. You can customize the format of Purify's messages. For example, you can increase the
number of lines of source code that are displayed, or include instruction pointers and
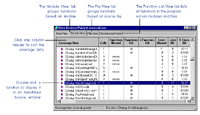
offsets to make locating errors easier. Purify makes it easy to correct errors. More information? Look up source code in the Purify online Help index. To make sure that you find errors in your code wherever they occur, use Purify to monitor code coverage each time you run your program. With Purify's coverage feature, you can check that you're exercising all your code, especially those parts that have recently been added or modified. Purify displays coverage data in views that you can sort to find the largest gaps in your testing. 
Click to enlarge Purify can also display line-by-line coverage information marked directly on a copy of your code in an Annotated Source window. The color of each line of code indicates whether it is tested, untested, or partially tested, so that you can tell at a glance where you need to tighten up your testing. Click to enlarge Based on the coverage data, refine your approach to exercising your code to make sure you are testing all the critical lines and functions. If you are testing manually, try different menu commands, or enter new values for variables. If you are testing automatically, revise or add test scripts. More information? Look up coverage data in the Purify online Help index. Comparing program runsWhen you are satisfied that you've made good progress in eliminating errors, and that you can exercise the parts of your program that most need testing, rebuild. Then rerun the program under Purify. More information? You can compare coverage data from different runs using the Compare Runs tool
|
Copyright © 1999 by Rational Software Corporation. All rights reserved. |