The "Age of Required Knowledge"
The "Age of Required Knowledge"
With all the technology, data, and new analytics techniques available to us today, employees and executives are expected to be "in the know." We're living in the "Age of Required Knowledge." In this new age, you need to zero in on the right information and make the right decisions, because there is a "cost of not knowing."
Considering the speed at which tweets fly and press releases are fired off to mobile phones, you can't get caught not knowing. You can't afford to wind up as a sensational news headline, followed by a loss of shareholder value, loss of customers, and even possible regulatory fines.
According to Gartner, the average financial impact of poor data on businesses is $9.7 million per year.1
Poor data makes an impact. And a big impact at that. Masquerading under the guise of beautiful reports, poor data can instill a false sense of security. You need to trust your data, and be confident the decisions you're making based on that data are the right ones.
Trust isn't a given, and accurate insights shouldn't be either. To avoid getting caught not knowing something you should, you must be sure you're not depending on incorrect, incomplete or misleading data. You need an analytics solution that has the "smarts" to help you determine what your plan is, what happened, why it happened, and what will happen next.
But why stop there? To get a full, accurate picture of your data without blind spots, you should deploy predictive models that score your data against intended outcomes. And, use decision optimization that tells you, at the point of impact, just what to do.
Determine: What is our plan?
Determine: What is our plan?
The financial performance management process, "planning" for short, is essential for any large organization. Finance and business leaders create plans, budgets and forecasts, perform analysis and create scenarios to assess the risks and rewards of alternative strategies and actions.
But for many, planning is a major challenge, and a major headache. Finance teams spend way too much time on manual processes, collecting, consolidating, and validating data before they can even begin to analyze it. Plus, finance professionals and business managers often find budgeting, which is a key part of the planning process, to be burdensome and of little value in managing operations or executing corporate strategy.
At the heart of these broken processes are the underlying technologies, in many cases simply emails and spreadsheets.

Spreadsheets are ubiquitous. They're appealing because of their familiarity but ill-suited to enterprise-scale planning and notoriously susceptible to error. One wrong keystroke and poof! The most carefully crafted budget or forecast becomes a booby trap. Exaggeration? Not really. To illustrate, here are three examples of spreadsheet errors that actually made world headlines.
The $100 million "Oops!"
In 2014, the number of outstanding shares of a software company in the process of being sold was misstated because of one small spreadsheet error. So, the sale price of the company was also misstated. When the transaction was completed, shareholders received $100 million less than they expected. Oops. Not a good day for anyone but the litigators.
Pundits and pols
In what one economist called "L'affaire Excel," spreadsheet errors made international headlines in 2013 when the authors of an influential study "accidentally excluded some data in one case and used some wrong data in another." When the errors were discovered, they caused embarrassment and backpedaling by pundits and politicians around the world who had depended on the study to support their economic policies.4
10,000 fans disappointed at the London Olympics
The 2012 Olympics in London are remembered for many things. But 10,000 fans of synchronized swimming may remember it best for an event that they didn't get to attend. Because of a single keystroke error, the event was oversold by 10,000. The disappointed ticketholders were offered tickets to other, presumably less-synchronized, events.5
Even small errors can cause headaches, embarrassment, and be sub-optimal, career-wise.
A spreadsheet error at your organization might never hit the headlines. But even small errors can cause headaches, embarrassment and be sub-optimal, career-wise. Truth be told, it's not really the spreadsheet's or the finance professional's fault. It's simply the nature of any process that involves lots of manual cutting, pasting and inputting of data.
That's why leading organizations are supplementing their spreadsheets with new technology to augment and automate their critical planning processes. Companies are now able to eliminate unproductive activities like tracking down numbers, fixing broken links and debugging macros. Instead, they can spend their time using best practices such as driver-based planning and rolling forecasts to help them anticipate and respond to the disruptive forces driving the marketplace.
Why IBM Business Analytics?
See how IBM is committed to solving big problems with a portfolio focused on enterprise challenges.
Descriptive analytics: Find out what happened
Descriptive analytics: Find out what happened
"Analytics for everyone!" This is the rallying cry that sparked a proliferation of desktop business intelligence (BI) tools in businesses of all sizes and industries. Nowadays, most companies feel like they can answer "what happened," and are getting to some of the "why did it happen" with BI, visualization, and data science-integrated software.
Make no mistake: desktop tools made self-service BI possible. These tools are producing beautiful charts and dashboards. They're so compelling that many people rush to act on what they're seeing. Although speed is good, acting before you answer the more advanced questions can have serious consequences.
KPMG reports that 84 percent of CEOs are concerned about the quality of the data they're basing decisions on.6
To build real confidence in your data, start by fixing the problems that can undermine your analytics. Be aware of the blind spots so you can hit them before they hit you.
Blind spot: Attractive drivers
Attractive answers aren't just attractive because they're beautifully visualized. They also seem easy, they feel right, and they might even echo your theory of how to move forward. They'll tell you what you want to hear, not necessarily what you need to hear.
Blind spot: Unlicensed drivers
Gone are the days of data reports waiting on the desks of data scientists. With self-service, desktop BI applications, everyone can produce reports. However, this has also created a number of unlicensed drivers.

Each person could be choosing different data sources. They could be aggregating or analyzing that data with different methods. If they miss a key factor, or water down the meaning to produce a visualization, you're forced to base your decisions on untrustworthy sources. Even if the data shown is correct, the way the data is portrayed in the visualization may not be.
Blind spot: Wrong methods and quick insights
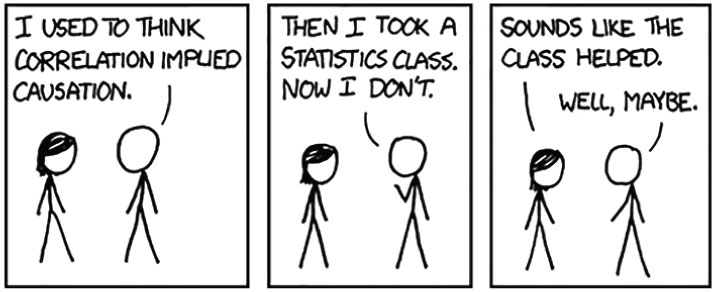
Most of us have heard that "correlation doesn't equal causation," and perhaps we've seen examples of funny correlations like these:
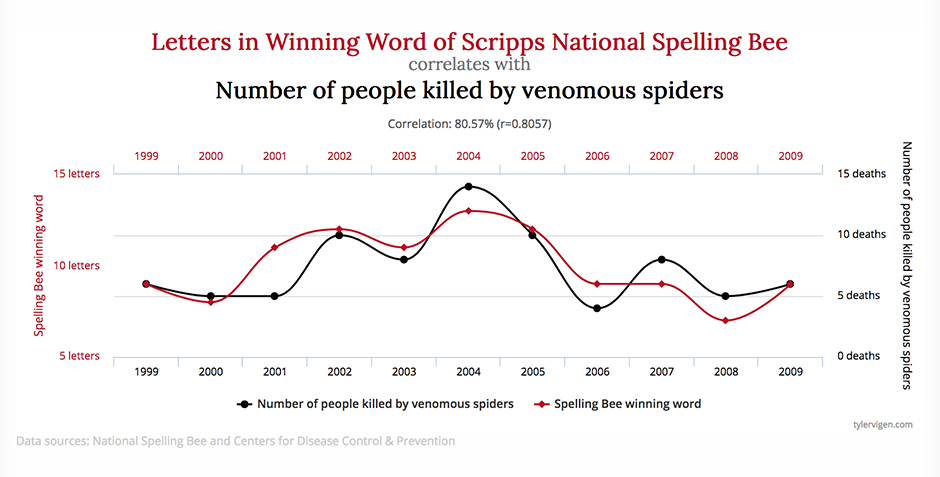
Obviously, we know better than to mistake correlation for causation in these silly examples. But, not all misleading data relationships are so easy to spot. As Marc Altshuller, General Manager of IBM Business Analytics, has pointed out, humans inevitably have biases, and these impact the process of deciding which correlations to credit and which to ignore.
Treat your data intelligently
Your data can be a phenomenal resource, but only if you treat it intelligently. Ensure you're building your analytics on a strong foundation, otherwise the whole house comes down.
To help manage your blind spots, there are four simple questions you should ask:
- Is any data missing?
- Is any information incorrect?
- Is any of the information misleading?
- Are the numbers misrepresented?
It's critical that you can confidently answer these questions about the data that powers your decisions. Move beyond acting on quick (and misleading) insights to cut through the uncertainty of "what happened" while getting deeper insights into the why. Once you've strengthened that foundation, then you can move forward and make advanced analytics attainable for everyday decision-makers.
Diagnostic analytics: Why did it happen?
Diagnostic analytics: Why did it happen?
With 2.5 quintillion bytes of data being produced per day, the world's data is a goldmine of information. Finding only what you need is paramount in uncovering complex business challenges. The trick lies in finding not only the data you think is right, packaged as a pretty visualization, but also the data that is right, and why. You can do this by identifying the root cause behind what happened, and be the first to discover the drivers that move the needle for your organization before the competition beats you to the punch.
Getting to the root cause hiding outside your purview
Equally important as the "what happened," with descriptive analytics is getting to the root reason, or "why it happened." These questions come to mind:
- What are the series of events that influenced the business outcomes?
- Where do the true correlation and causality lie within a given historical time frame?
- What are the drivers behind your findings?
You need to detect patterns and relationships and their true drivers to get to the real story and debunk false correlations. That's where diagnostic analytics and data discovery come in, enhanced by machine learning and predictive capabilities for maximum impact.
With guided data discovery, it's possible to drill down into exact causes without having to determine the criteria you're looking for and without knowing what correlations might already exist. Throw your assumptions and past experiences aside, because there are rich and telling stories in data that live beyond your purview.
To get beyond what isn't known and avoid zeroing in on the wrong information "missing the forest for the trees" use smart data discovery enhanced with machine learning. Intelligent computing systems can bring you suggestions for possible causalities. Then, you can create automated visualizations with the correct configuration to accurately deliver your information back to your organization for easy understanding.
Visualization: Presentation without misrepresentation
Visualizations allow organizations to report and distribute information more quickly, and to a broader audience. According to research done by 3M, humans process visual information 60,000 times faster than text.7 Images help your brain extract meaning in a snap, making your data more evocative, memorable, and effective. A study by AdWeek reveals that tweets with images are 150% more likely to get retweeted.8 The challenge lies in assessing the right triggers and getting a beautiful image that accurately presents all the relevant information without misrepresentation.
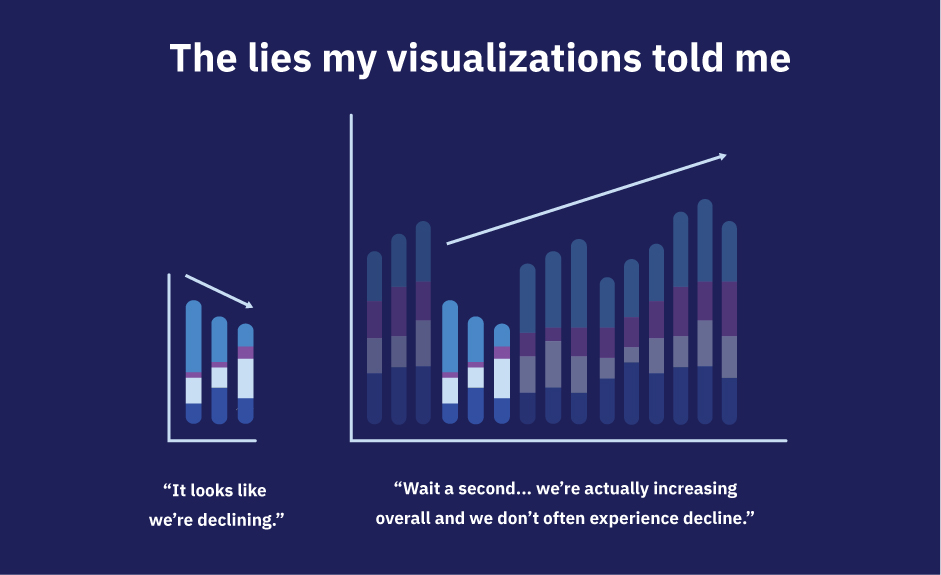 Do you believe the sweet nothings that misrepresented data visualizations whisper in the night?
"Perhaps the greatest danger in using dashboards for decision making is in mis-attributing causality when comparing elements on the dashboard."
- Joel Shapiro, Professor and Executive Director of the Data Analytics Program at Northwestern's Kellogg School of Management
Avoid presenting your data in a misleading manner with visuals that most precisely represent the facts and true causes. You want the brains and the beauty. Smarts like machine learning drill down to the right information, while beautiful dashboards are the vehicle. You'd bet your spreadsheets can't tackle this alone. You'd be right, this time.
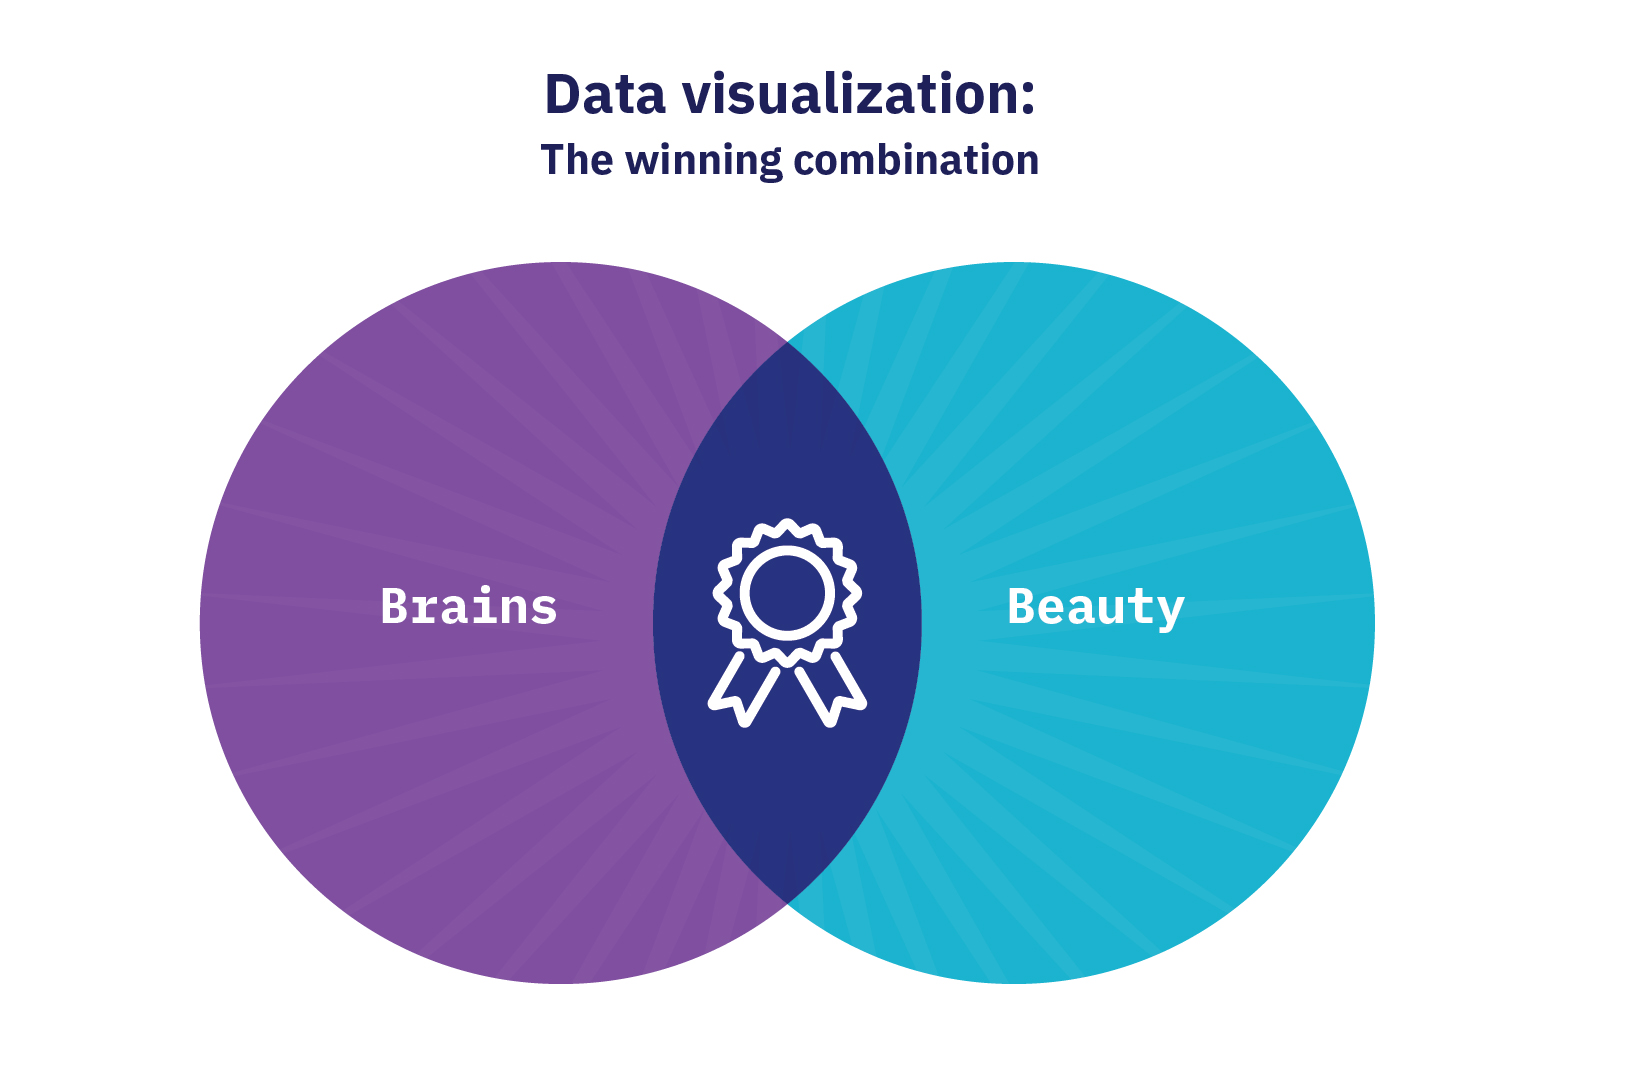 Beauty and intelligence... the winning combination when it comes to picking your spouse, and visualizing your data.
Predictive analytics: Find out what will happen next
Predictive analytics: Find out what will happen next
There was a time not that long ago when finding the "why" in your data was cutting edge. But it didn't take long for companies to realize this was not a way to operate successfully. There were too many misses.
"How we deliver actionable insights to business users was science fiction years ago, now it's fact."
- Mathew DiAntonio, VP, Business Analytics, Carbonite
Enter predictive analytics, a combination of advanced analytics capabilities that span statistical analysis, predictive modeling, data mining, text analytics, entity analytics, optimization, real-time scoring and machine learning. With these capabilities, organizations discover patterns in data so they can go beyond knowing what has happened to anticipating the future.
For example, AMC Networks, the geniuses behind such popular shows as Breaking Bad, Mad Men, and the Walking Dead uses predictive analytics to predict which shows will be successful. Not only that, but armed with models and analysis, they can determine when to schedule the shows, what promotions it should create, and who their targets should be. The end result? They win new audience share in an increasingly competitive market.
Desktop predictive? It's your loss
Like any reliable source of insights, predictive analytics is more than a desktop tool that suggests the factors most likely to affect outcomes. For example, if you ask a data discovery tool what drives basketball team wins, a top factor will be "losses."
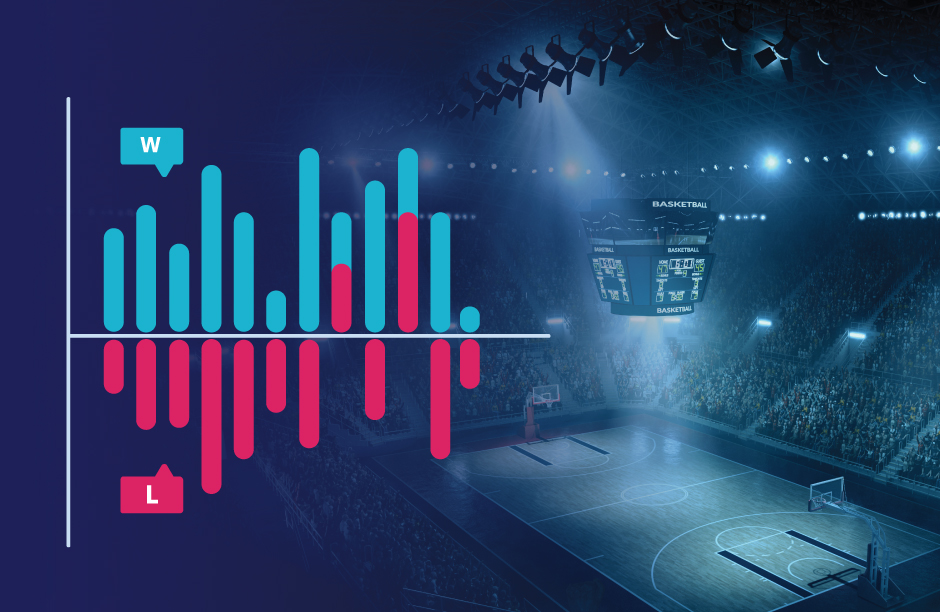
If you didn't know anything about basketball, you might think you'd discovered the secret to predicting which team would win a hotly contested game. But if you're any kind of fan, you know you need much more data to get to your winner. That's why predictive analytics is composed of so many capabilities, you have to have the full picture to discover what will happen next.
The transformative power of predictive analytics
Predictive analytics can quickly transform plain guesswork to predictions with a degree of certainty. It shows you where you can go based on analysis of trends, patterns, and relationships from data. You're also provided with the direction necessary to predict future events so you can make confident decisions about how to move your business forward.
When XO Communications wanted to understand why customers were switching to competitors, they used predictive analytics software to create models that generate a "churn score" for each customer they provide customer care reps. Because they have accurate churn predictions, the customer care reps can resolve issues quickly, improve service levels, and ultimately increase the retention rate.
XO Communications takes control of customer satisfaction by using predictive analytics to embed a deeper understanding of customers into operations. Learn more about this predictive analytics solution.
Prescriptive analytics: What should we do?
Prescriptive analytics: What should we do?
Decisions, decisions. We all have to make them, but it's never easy, even when you're equipped with intelligence and predictions. Yes, you know what happened and why it happened. And you know what is likely to happen next. But, you still have to contend with a dizzying array of options for making the most of your resources while managing constraints. Make the wrong choice, and your organization could suffer the consequences for a long time to come. Fortunately, with prescriptive analytics, you can avoid the miserable after-effects of the wrong decision. Prescriptive analytics addresses the uncertainty of making the right decision when there are a number of factors to consider, with technology, automation, and velocity.

For example, a major German tour operator created a hotel pricing system based on prescriptive analytics technology. It precisely tailors prices to customer behavior and makes all price information continually available to pricing specialists.
As a result, 50-100 hotels in a desirable tour region can be priced in less than 20% of the time of manual pricing methods. Pricing consistency, such as ensuring a four-star hotel is always less expensive than a five-star, is at 100%.9
"How was it possible that mathematical optimization could do in five seconds what simulation took us 48 hours to do?"10
- Susara van den Heever, Product Manager, IBM Decision Optimization
Addressing uncertainty with smarts and speed
Prescriptive analytics technology tells us what we should do by recommending actions based on desired outcomes while taking into account specific scenarios, resources, and knowledge of past and current events. Decision processes are automated to increase the smarts and speed of your responses to today's accelerating markets. You, your managers and planners can focus on critical complexities rather than on routine issues.
Prescriptive analytics runs through alternative actions or decisions given a complex set of requirements, objectives and constraints faster than you can imagine. According to Susara van den Heever, Product Manager, IBM Decision Optimization, the speed was mind-boggling: "Instead of running hundreds of simulations, we specified an objective to maximize efficiency, clicked a Solve button, and five seconds later saw the best design. I was hooked. How was it possible that mathematical optimization could do in five seconds what simulation took us 48 hours to do?"10
Changing your decision dynamics for competitive advantage
Prescriptive analytics shows you the optimal decision for specific scenarios. You can then act fast in dynamic conditions with uncertain environments to gain a strong competitive advantage. The result is smarter decision-making across the board. Why? Because you're seeing choices that are not immediately obvious, choices that maximize your value or minimize your costs while also taking into account the complex requirements and strategies of modern business.
Bringing it all together
Bringing it all together
When you look at your business results, you will naturally question why certain things are happening. It's how you answer those questions that determines your level of competitive advantage. Companies that apply 'smarts' to those questions are relying on cognitive services, machine learning, optimization and pattern-based planning to drive better decision-making and identify trends before they even know which questions to ask.
When you think about transforming business processes by traversing the five main types of analytics — planning, descriptive, diagnostic, predictive, and prescriptive — you must remember to first start with a solid analytics foundation. Question what you're seeing. Manage the blind spots that can undermine your analytics. Once you've done that, then you can start getting to better answers you can trust, so you can be confident that the business decisions you're making are the right ones.
Next steps

Get started
Disrupt or be disrupted. Learn how you can gain trust and confidence in your data.

See analytics in action
See the complete view of analytics you can trust in action so you can catapult your business forward.

Download PDF
Download the PDF Version of this document.
Sources
- "The Data Differentiator: The Data Differentiator: How Improving Data Quality Improves Business," Forbes Insights, 2017
- Jeremy Olshan, "88% of spreadsheets have errors" Marketwatch, April 20, 2013
- Paul Kelso, "London 2012 Olympics: lucky few to get 100m final tickets after synchronized swimming was overbooked by 10,000," The Telegraph, January 4, 2012
- Matthew O'Brien, "Who Is Defending Austerity Now? The Excel error heard 'round the world has deficit-cutters backpedaling" The Atlantic, April 22, 2013
- Gillian Tan, "Spreadsheet Mistake Costs Tibco Shareholders $100 Million," The Wall Street Journal, October 16, 2014,
- 2016 Global CEO Outlook, KPMG International, June 2016.
- "Polishing Your Presentation," 3M Meeting Network, 1997
- Shea Bennett. "Tweets With Images Get 18% More Clicks, 89% More Favorites and 150% More Retweets," AdWeek, 2013
- Vivian Braun, "Prescriptive versus predictive: An IBMer's guide to advanced data analytics in travel," tnooz, July 17, 2013
- Susara van den Heever, "Analytics' best-kept secret is decision optimization," IBM Big Data and Analytics Hub, May 29, 2015