The next wave of business intelligence
The companies that thrive will be those that embrace change and make fast, data-driven decisions using augmented analytics.
The next wave of business intelligence
The companies that thrive will be those that embrace change and make fast, data-driven decisions using augmented analytics.
Table of contents
Table of contents
Key points
Introduction: in the midst of a revolution
The cotton mill. The assembly line. The microprocessor. What do these three technologies have in common?
They are what drove the first, second and third industrial revolutions. Each of them forced a transformation that rippled across the globe, upending industries, processes and society as a whole. The cotton mill led to the birth of the modern factory in England. The assembly line ushered in the age of mass production. The microprocessor, aided by radical advances in networking, put a computer on every desktop and a smartphone in every pocket.
Now we find ourselves in the midst of a fourth industrial revolution — one driven by data. It builds upon its predecessors while being spurred on by artificial intelligence, machine learning, pattern detection, data science and more.
All such revolutions are disruptive. Cotton mills crushed hand looms in the early 18th century. Henry Ford’s mastery of the assembly line pushed horse-drawn carriages off the road 200 years later. Microprocessors killed off some industries while launching others.
The fourth industrial revolution is doing the same, breaking old norms while setting off waves of complementary innovations and opportunities.

Companies that succeed in this revolution will be the ones who embrace the changes and make quick, confident, data-driven decisions.
The million-dollar question remains: where to start?
The starting point: rapid, accurate operational decisions
A new culture of data-driven decision-making is emerging, but making the right decision is only part of the equation. Decisions must be made rapidly and often, especially in high-impact moments when a customer is engaged or an urgent operational need arises. Hitting the mark for fast and accurate decisions requires that your analytics tools instantly turn your data into relevant insights , giving the right people the right information and removing any obstacles to clarity. Modern analytics solutions achieve this with tailored reports and dashboards that transform a mass of data into visualizations that convey a breadth and depth of insight.
For most business users, the face of data analytics — the point of engagement — is the dashboard visualization. For that reason, compelling visualizations built on trusted data ought to be one of the most important components of your analytics strategy. By contrast, visualizations that are hard to understand, or that are built on misleading, incorrect or missing data, will quickly become your weakest link.
Think about it: decision makers use dashboards to make countless decisions every day, many of them with serious implications for the health of the business. Add up all those decisions made across an organization, and you’re looking at hundreds of thousands of decisions per year. That’s a lot of opportunity to get things right or get things wrong.
Get it right, and you harness the fourth industrial revolution to generate constant innovation, ongoing operational refinements and early warnings of trouble. Get it wrong, and you face endless missteps and lost opportunities that could chip away at your company’s strength.
From a data analytics perspective, bad decisions come from multiple sources. You might have missing data, whether from a faulty data import or simply because your sources aren’t broad enough. There could be incorrect data, often arising from mistakes made in data entry or the processes of stitching data together for analysis.
Also, you could have misleading information; even if the underlying data are correct and properly visualized, unintended biases might cause them to be misinterpreted. Finally, nobody wants to think that their colleagues would deceive them, but misrepresented information does happen when employees engage in unethical or illegal behavior and try to cover their tracks, or simply just juice the numbers to make their work performance look better to land a bonus or raise.
How can you be certain these pitfalls aren’t affecting you? By taking a proactive approach that operationalizes analytics within every function and throughout every level of the enterprise. When your users have the skills and tools to independently interrogate data, build upon existing reports and create new dashboards as needed, they can explore new patterns and relationships in the data, uncovering gaps, errors, biases and other issues as they go. That is how you build a rock-solid approach to trusted analytics, which allows your organization to prevent the problems listed above and avoid being blindsided by business disruptions.
Ask yourself these 4 simple questions
to fix the problems that can undermine your analytics
1
Is any data missing?
2
Is any information incorrect?
3
Is any information misleading?
4
Are the numbers misrepresented?
The difference that augmented analytics makes
Augmented analytics has become the essential differentiator for business decision-making. It expands the expertise and improves the effectiveness of every leader, stakeholder and individual contributor by allowing them to learn, adapt to and outthink the needs of the market — in the moment and at the point of impact where smarter decisions are most needed. And by accumulating data and insight from every interaction, augmented systems grow continuously more effective over time.
The business world has barely scratched the surface of augmented analytics’ potential to enhance, accelerate and scale human expertise.
Wider adoption and new advances will enable organizations to:
- Uncover insights and patterns that would have otherwise remained hidden or siloed
- Engage with data in new ways to achieve new discoveries
- Draw upon those new insights to make better decisions for managing performance
- Dig deeper, ask better questions, explore previously unconsidered possibilities and innovate boldly
A smarter wave of analytics
Similar to data analytics, there's more to fish than just a pretty picture. Fish swim in schools to save energy, optimize food prospects and reduce risk from dangerous predators. The same can be said for data analytics. By moving beyond the pretty picture and applying smarter analytic and data science technologies, you can and save time and energy, optimize your business processes and mitigate the risk of dangerous decisions.
It's time to go beyond the beauty of pretty visualizations to the real impact of advanced analytics.
Reimagining what’s possible: infusing AI into BI
Traditional business intelligence (BI) solutions have no hope of making sense of the volume, variety and velocity of data being created. Harnessing this flood of business data requires a new approach to BI, one that is enabled by the smarts embedded in IBM Cognos Analytics. Powered by an ever-growing set of augmented intelligence (AI) features, Cognos Analytics has been reconceived for the needs of today’s organizations and users.
The overarching challenge is to give every user — whether data scientist, business analyst or non-specialist — more power to perform relevant analysis in a way that ties back to organizational objectives. Cognos Analytics accelerates this process, shortening each user’s journey from simple to sophisticated analytics, ultimately allowing both business users and IT pros to harness data to explore the unknown, identify novel relationships in data, get a deeper understanding of outcomes and challenge the status quo.
New machine learning and natural-language elements augment the BI functions in Cognos Analytics with smart data analysis and visualization capabilities that help business users discover the underlying patterns and meanings in their data. For example, the software can detect the types of data being examined and analysis desired, then intelligently suggest the best visualizations to use.
AI features such as natural language dialogue, guided analytics and smart visualizations increase not only personal productivity but enterprise agility. The organization-wide benefits that flow from this approach are many. It assures insights come from data vetted for accuracy, completeness and lack of bias. This enhances collaboration and instills confidence in the intelligence that drives decisions.
In the bigger picture, Cognos Analytics primes enterprises to seize opportunities and respond swiftly to emerging threats. In a business climate where previous borders, boundaries and business-as-usual no longer apply, AI-powered BI helps businesses thrive as they redefine what’s possible.
Smarter self-service
The world has moved to a new model. There is more data to handle than ever before, along with a greater need for relevant in-the-moment insights; those who have good data and can use it best will win. Yet IT budgets are tightly constrained, the supply of data scientists and business analysts cannot come close to meeting the demand and old, siloed processes for wrangling data and producing analysis will never meet the need for real-time analytics.
Given these pressures, the implication is clear: analytics must be spread throughout the organization such that everyday users can perform sophisticated analytical tasks in the regular flow of their jobs. Unfortunately, too many BI tools are designed for users who already have advanced knowledge of databases and analytical techniques — or, alternately, they’re user-friendly and pretty to look at, but without enough analytical horsepower under the hood.
That’s why Cognos Analytics includes smarter self-service capabilities that make it simple, clear and easy to use, whether you are an experienced business analyst examining the kinks in a vast supply chain or a marketer optimizing a single campaign. Cognos Analytics uses AI and other intelligent capabilities to do the heavy lifting to guide data exploration, present compelling insights and make it easier for users to get the answers they need. All of that enables faster, better decisions and maximizes financial and operational gains.
What’s new in Explorer
New reporting capabilities are coming to IBM Cognos Analytics. Deliver much more than just stunning results -- discover how to make your data work for you, brilliantly.
Individuals can view or interact with dashboards and reports, with access determined by role, department or user. They can subscribe to reports pulled in from multiple sources, have them refreshed daily and set specific reports as their home page, without having to involve IT — but still operating within the guardrails of effective data governance.
In a responsive self-service environment every user can perform the data exploration and visualization appropriate to their role. From the individual’s perspective, work gets done faster and with less fuss. From the organizational perspective, diverse viewpoints and new insights come to light, uncovering business issues and pointing to innovative approaches that would never be found otherwise. That’s the impact of smarter self-service.
Smarter data prep and modeling
According to some estimates, 40 to 60 percent of a business analyst’s time is typically spent searching for data or preparing it — the groundwork that must be done before any actual analysis can happen. Fortunately, new analytics capabilities are creating alternatives to this inefficient use of analysts’ time and talents. Cognos Analytics allows users to find and prepare data much faster than before, vastly reducing the time and effort required to move from raw data to deep insights.
Again, AI and other smart features pave the way. Natural-language queries search across the entire range of available data sources to quickly find relevant content. Simple visual tools allow users to precisely join multiple datasets from different enterprise systems, and even supplement them with their own spreadsheets. All of this can be done in just minutes, without needing to know the right database commands or seek help from a data engineer.
The system’s intent-driven approach streamlines modeling by automatically identifying any problems in the data and suggesting ways to combine different data sources, then allowing users to adapt and customize datasets and dashboards as needed. The process makes it faster and easier for a business user to cleanse, refine and combine data modules so that they end up with exactly the data they need to drive powerful visualizations and uncover new insights.
What’s new in dashboarding
There are lots of new features coming to IBM Cognos Analytics to make the dashboard more flexible and powerful so you can communicate your findings in compelling and engaging ways.
What’s new in reporting
New reporting capabilities are coming to IBM Cognos Analytics. Deliver much more than just stunning results — discover how to make your data work for you, brilliantly.
Data Preparation and Modeling
This video presents a deeper dive into using Data Modules in Cognos Analytics. It takes you through a use case story so you can see how to join multiple corporate and external data sources, refine data properties and build navigation groups and custom groups.
Smarter reporting and dashboarding
Reporting and dashboarding are at the heart of a modern approach to analytics. Organizations rely on regular, structured reporting to run the business right. These formal reports collect and disseminate the crucial details that support good decision-making, and they provide jumping-off points for further exploration of trends, threats and opportunities. That further exploration often happens at the point of engagement already described — dashboard visualizations — where business users also turn to get their daily jobs done.
Cognos Analytics incorporates many smart features to enable better data analytics through both reports and dashboards. Meanwhile, the AI features embedded throughout Cognos Analytics learn from users and help guide their analysis, especially by recommending visualizations that have the highest impact for discovering and communicating new insights. One compelling area where deep data analysis and strong visual impact come together is mapping; the system automatically identifies geographical information and makes it a breeze to refine visualizations by adding geospatial mapping of the entire globe, an individual neighborhood or anything in between. Compelling dashboards, infographics and even animated presentations can also be created quickly and intuitively using drag-and-drop functionality, automated formatting and a suite of design tools for customization.
Traditional reporting and dashboarding are often very static and siloed; everything in Cognos Analytics, by contrast, is designed to promote not just dynamic insights but collaboration. At every turn, we’ve made it easier and faster to perform analysis and then get the word out about your findings. Visualization and presentation tools are a key contributor because they support powerful storytelling that allows you to communicate your insights to others in a compelling way, thereby accelerating decision-making. Plus, the system’s tools for sharing make it easy for colleagues to work together on analytics tasks.
The IBM advantage
Cognos Analytics brings BI up to speed for the revolutionary moment we live in. It delivers all the functions of traditional BI but augments them with many AI-driven elements and self-service features that match modern ways of working — and deliver stronger insights.
The all-new Cognos Analytics isn’t only built for the enterprise. It’s built for the everyday user. The data explorer who is primarily using spreadsheets and data discovery tools to do data analysis and create reports and dashboards. The problem is, the pretty pictures they’re painting only explain what happened; not why it happened. That’s where the all-new Cognos Analytics comes in. Available at a new, low price, you can now afford to find the answers no one else can find.
As business users become increasingly adept at exploring and engaging with data for new discoveries, IT is freed from the role of handling these types of requests on their behalf. As a result, IT is able to sharpen its focus on strategic issues and the bigger picture of enterprise technology.
Cognos Analytics also plays a crucial role in the larger Analytics Cycle shown here.
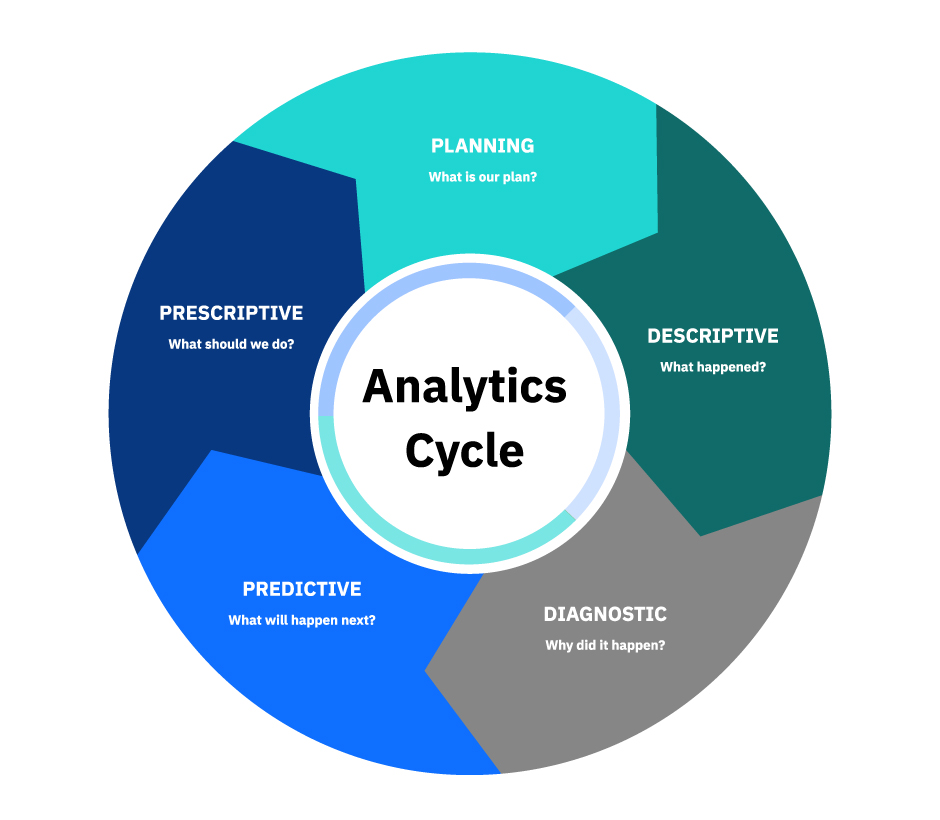
Companies that want to thrive during the fourth industrial revolution will get the most out of their data by engaging with all five parts of the cycle, from planning to prescriptive analytics. By combining descriptive and diagnostic analytics, Cognos Analytics places traditional BI in the much more powerful context of modern data analytics and a sophisticated analytics strategy.
This comprehensive approach to analytics minimizes bias, maximizes the value you derive from your data and ultimately paves the way to better answers for your business. IBM is uniquely positioned to help you on this path because we deliver all of the capabilities you need across the Analytics Cycle on a single platform. You can begin wherever you are — Cognos Analytics for descriptive and diagnostic analytics is a perfect starting point — and then expand your technology and processes to embrace the entire cycle.
It’s only when you make analytics a pervasive practice across your business that you become a truly data-driven organization. That transformation will change the way you work, and give you the speed, agility and confidence you need as you make better, smarter decisions. Far from being disrupted by the flood of data, you will become the disruptor — not part of the old way being torn down, but part of the revolution building the new way of doing business.
Next steps

Try Cognos Analytics
Get started with a free trial of IBM Cognos Analytics today.

It's Time to Move Beyond Basic BI
Read this report from Aberdeen Research to learn why the best-in-class companies are looking to leverage AI-infused BI.

Why We’re a Top-Ranked BI Solution
See why IBM has been named a market leader in the recent BARC Score Business Intelligence report.

Download PDF
Download the PDF version of this white paper.
Table of contents
Introduction: in the midst of a revolution
Introduction: in the midst of a revolution
The cotton mill. The assembly line. The microprocessor. What do these three technologies have in common?
They are what drove the first, second and third industrial revolutions. Each of them forced a transformation that rippled across the globe, upending industries, processes and society as a whole. The cotton mill led to the birth of the modern factory in England. The assembly line ushered in the age of mass production. The microprocessor, aided by radical advances in networking, put a computer on every desktop and a smartphone in every pocket.
Now we find ourselves in the midst of a fourth industrial revolution — one driven by data. It builds upon its predecessors while being spurred on by artificial intelligence, machine learning, pattern detection, data science and more.
All such revolutions are disruptive. Cotton mills crushed hand looms in the early 18th century. Henry Ford’s mastery of the assembly line pushed horse-drawn carriages off the road 200 years later. Microprocessors killed off some industries while launching others.
The fourth industrial revolution is doing the same, breaking old norms while setting off waves of complementary innovations and opportunities.
Companies that succeed in this revolution will be the ones who embrace the changes and make quick, confident, data-driven decisions.
The million-dollar question remains: where to start?
The starting point: rapid, accurate operational decisions
The starting point: rapid, accurate operational decisions
A new culture of data-driven decision-making is emerging, but making the right decision is only part of the equation. Decisions must be made rapidly and often, especially in high-impact moments when a customer is engaged or an urgent operational need arises. Hitting the mark for fast and accurate decisions requires that your analytics tools instantly turn your data into relevant insights , giving the right people the right information and removing any obstacles to clarity. Modern analytics solutions achieve this with tailored reports and dashboards that transform a mass of data into visualizations that convey a breadth and depth of insight.
For most business users, the face of data analytics — the point of engagement — is the dashboard visualization. For that reason, compelling visualizations built on trusted data ought to be one of the most important components of your analytics strategy. By contrast, visualizations that are hard to understand, or that are built on misleading, incorrect or missing data, will quickly become your weakest link.
Think about it: decision makers use dashboards to make countless decisions every day, many of them with serious implications for the health of the business. Add up all those decisions made across an organization, and you’re looking at hundreds of thousands of decisions per year. That’s a lot of opportunity to get things right or get things wrong.
Get it right, and you harness the fourth industrial revolution to generate constant innovation, ongoing operational refinements and early warnings of trouble. Get it wrong, and you face endless missteps and lost opportunities that could chip away at your company’s strength.
From a data analytics perspective, bad decisions come from multiple sources. You might have missing data, whether from a faulty data import or simply because your sources aren’t broad enough. There could be incorrect data, often arising from mistakes made in data entry or the processes of stitching data together for analysis.
Also, you could have misleading information; even if the underlying data are correct and properly visualized, unintended biases might cause them to be misinterpreted. Finally, nobody wants to think that their colleagues would deceive them, but misrepresented information does happen when employees engage in unethical or illegal behavior and try to cover their tracks, or simply just juice the numbers to make their work performance look better to land a bonus or raise.
How can you be certain these pitfalls aren’t affecting you? By taking a proactive approach that operationalizes analytics within every function and throughout every level of the enterprise. When your users have the skills and tools to independently interrogate data, build upon existing reports and create new dashboards as needed, they can explore new patterns and relationships in the data, uncovering gaps, errors, biases and other issues as they go. That is how you build a rock-solid approach to trusted analytics, which allows your organization to prevent the problems listed above and avoid being blindsided by business disruptions.
Ask yourself these 4 simple questions
to fix the problems that can undermine your analytics
1
Is any data missing?
2
Is any information incorrect?
3
Is any information misleading?
4
Are the numbers misrepresented?
The difference that augmented analytics makes
The difference that augmented analytics makes
Augmented analytics has become the essential differentiator for business decision-making. It expands the expertise and improves the effectiveness of every leader, stakeholder and individual contributor by allowing them to learn, adapt to and outthink the needs of the market — in the moment and at the point of impact where smarter decisions are most needed. And by accumulating data and insight from every interaction, augmented systems grow continuously more effective over time.
The business world has barely scratched the surface of augmented analytics’ potential to enhance, accelerate and scale human expertise.
Wider adoption and new advances will enable organizations to:
- Uncover insights and patterns that would have otherwise remained hidden or siloed
- Engage with data in new ways to achieve new discoveries
- Draw upon those new insights to make better decisions for managing performance
- Dig deeper, ask better questions, explore previously unconsidered possibilities and innovate boldly
A smarter wave of analytics
Similar to data analytics, there's more to fish than just a pretty picture. Fish swim in schools to save energy, optimize food prospects and reduce risk from dangerous predators. The same can be said for data analytics. By moving beyond the pretty picture and applying smarter analytic and data science technologies, you can and save time and energy, optimize your business processes and mitigate the risk of dangerous decisions.
It's time to go beyond the beauty of pretty visualizations to the real impact of advanced analytics.
Reimagining what’s possible: infusing AI into BI
Reimagining what’s possible: infusing AI into BI
Traditional business intelligence (BI) solutions have no hope of making sense of the volume, variety and velocity of data being created. Harnessing this flood of business data requires a new approach to BI, one that is enabled by the smarts embedded in IBM Cognos Analytics. Powered by an ever-growing set of augmented intelligence (AI) features, Cognos Analytics has been reconceived for the needs of today’s organizations and users.
The overarching challenge is to give every user — whether data scientist, business analyst or non-specialist — more power to perform relevant analysis in a way that ties back to organizational objectives. Cognos Analytics accelerates this process, shortening each user’s journey from simple to sophisticated analytics, ultimately allowing both business users and IT pros to harness data to explore the unknown, identify novel relationships in data, get a deeper understanding of outcomes and challenge the status quo.
New machine learning and natural-language elements augment the BI functions in Cognos Analytics with smart data analysis and visualization capabilities that help business users discover the underlying patterns and meanings in their data. For example, the software can detect the types of data being examined and analysis desired, then intelligently suggest the best visualizations to use.
AI features such as natural language dialogue, guided analytics and smart visualizations increase not only personal productivity but enterprise agility. The organization-wide benefits that flow from this approach are many. It assures insights come from data vetted for accuracy, completeness and lack of bias. This enhances collaboration and instills confidence in the intelligence that drives decisions.
In the bigger picture, Cognos Analytics primes enterprises to seize opportunities and respond swiftly to emerging threats. In a business climate where previous borders, boundaries and business-as-usual no longer apply, AI-powered BI helps businesses thrive as they redefine what’s possible.
Smarter self-service
Smarter self-service
The world has moved to a new model. There is more data to handle than ever before, along with a greater need for relevant in-the-moment insights; those who have good data and can use it best will win. Yet IT budgets are tightly constrained, the supply of data scientists and business analysts cannot come close to meeting the demand and old, siloed processes for wrangling data and producing analysis will never meet the need for real-time analytics.
Given these pressures, the implication is clear: analytics must be spread throughout the organization such that everyday users can perform sophisticated analytical tasks in the regular flow of their jobs. Unfortunately, too many BI tools are designed for users who already have advanced knowledge of databases and analytical techniques — or, alternately, they’re user-friendly and pretty to look at, but without enough analytical horsepower under the hood.
That’s why Cognos Analytics includes smarter self-service capabilities that make it simple, clear and easy to use, whether you are an experienced business analyst examining the kinks in a vast supply chain or a marketer optimizing a single campaign. Cognos Analytics uses AI and other intelligent capabilities to do the heavy lifting to guide data exploration, present compelling insights and make it easier for users to get the answers they need. All of that enables faster, better decisions and maximizes financial and operational gains.
What's New in Reporting
New reporting capabilities are coming to IBM Cognos Analytics. Deliver much more than just stunning results -- discover how to make your data work for you, brilliantly.
Individuals can view or interact with dashboards and reports, with access determined by role, department or user. They can subscribe to reports pulled in from multiple sources, have them refreshed daily and set specific reports as their home page, without having to involve IT — but still operating within the guardrails of effective data governance.
In a responsive self-service environment every user can perform the data exploration and visualization appropriate to their role. From the individual’s perspective, work gets done faster and with less fuss. From the organizational perspective, diverse viewpoints and new insights come to light, uncovering business issues and pointing to innovative approaches that would never be found otherwise. That’s the impact of smarter self-service.
Smarter data prep and modeling
Smarter data prep and modeling
According to some estimates, 40 to 60 percent of a business analyst’s time is typically spent searching for data or preparing it — the groundwork that must be done before any actual analysis can happen. Fortunately, new analytics capabilities are creating alternatives to this inefficient use of analysts’ time and talents. Cognos Analytics allows users to find and prepare data much faster than before, vastly reducing the time and effort required to move from raw data to deep insights.
Again, AI and other smart features pave the way. Natural-language queries search across the entire range of available data sources to quickly find relevant content. Simple visual tools allow users to precisely join multiple datasets from different enterprise systems, and even supplement them with their own spreadsheets. All of this can be done in just minutes, without needing to know the right database commands or seek help from a data engineer.
The system’s intent-driven approach streamlines modeling by automatically identifying any problems in the data and suggesting ways to combine different data sources, then allowing users to adapt and customize datasets and dashboards as needed. The process makes it faster and easier for a business user to cleanse, refine and combine data modules so that they end up with exactly the data they need to drive powerful visualizations and uncover new insights.
What’s new in dashboarding
There are lots of new features coming to IBM Cognos Analytics to make the dashboard more flexible and powerful so you can communicate your findings in compelling and engaging ways.
What’s new in reporting
New reporting capabilities are coming to IBM Cognos Analytics. Deliver much more than just stunning results — discover how to make your data work for you, brilliantly.
Data Preparation and Modeling
This video presents a deeper dive into using Data Modules in Cognos Analytics. It takes you through a use case story so you can see how to join multiple corporate and external data sources, refine data properties and build navigation groups and custom groups.
Smarter reporting and dashboarding
Smarter reporting and dashboarding
Reporting and dashboarding are at the heart of a modern approach to analytics. Organizations rely on regular, structured reporting to run the business right. These formal reports collect and disseminate the crucial details that support good decision-making, and they provide jumping-off points for further exploration of trends, threats and opportunities. That further exploration often happens at the point of engagement already described — dashboard visualizations — where business users also turn to get their daily jobs done.
Cognos Analytics incorporates many smart features to enable better data analytics through both reports and dashboards. Meanwhile, the AI features embedded throughout Cognos Analytics learn from users and help guide their analysis, especially by recommending visualizations that have the highest impact for discovering and communicating new insights. One compelling area where deep data analysis and strong visual impact come together is mapping; the system automatically identifies geographical information and makes it a breeze to refine visualizations by adding geospatial mapping of the entire globe, an individual neighborhood or anything in between. Compelling dashboards, infographics and even animated presentations can also be created quickly and intuitively using drag-and-drop functionality, automated formatting and a suite of design tools for customization.
Traditional reporting and dashboarding are often very static and siloed; everything in Cognos Analytics, by contrast, is designed to promote not just dynamic insights but collaboration. At every turn, we’ve made it easier and faster to perform analysis and then get the word out about your findings. Visualization and presentation tools are a key contributor because they support powerful storytelling that allows you to communicate your insights to others in a compelling way, thereby accelerating decision-making. Plus, the system’s tools for sharing make it easy for colleagues to work together on analytics tasks.
The IBM advantage
The IBM advantage
Cognos Analytics brings BI up to speed for the revolutionary moment we live in. It delivers all the functions of traditional BI but augments them with many AI-driven elements and self-service features that match modern ways of working — and deliver stronger insights.
The all-new Cognos Analytics isn’t only built for the enterprise. It’s built for the everyday user. The data explorer who is primarily using spreadsheets and data discovery tools to do data analysis and create reports and dashboards. The problem is, the pretty pictures they’re painting only explain what happened; not why it happened. That’s where the all-new Cognos Analytics comes in. Available at a new, low price, you can now afford to find the answers no one else can find.
As business users become increasingly adept at exploring and engaging with data for new discoveries, IT is freed from the role of handling these types of requests on their behalf. As a result, IT is able to sharpen its focus on strategic issues and the bigger picture of enterprise technology.
Cognos Analytics also plays a crucial role in the larger Analytics Cycle shown here.
Companies that want to thrive during the fourth industrial revolution will get the most out of their data by engaging with all five parts of the cycle, from planning to prescriptive analytics. By combining descriptive and diagnostic analytics, Cognos Analytics places traditional BI in the much more powerful context of modern data analytics and a sophisticated analytics strategy.
This comprehensive approach to analytics minimizes bias, maximizes the value you derive from your data and ultimately paves the way to better answers for your business. IBM is uniquely positioned to help you on this path because we deliver all of the capabilities you need across the Analytics Cycle on a single platform. You can begin wherever you are — Cognos Analytics for descriptive and diagnostic analytics is a perfect starting point — and then expand your technology and processes to embrace the entire cycle.
It’s only when you make analytics a pervasive practice across your business that you become a truly data-driven organization. That transformation will change the way you work, and give you the speed, agility and confidence you need as you make better, smarter decisions. Far from being disrupted by the flood of data, you will become the disruptor — not part of the old way being torn down, but part of the revolution building the new way of doing business.
Next steps
Next steps
Try Cognos Analytics
Get started with a free trial of IBM Cognos Analytics today.
It's Time to Move Beyond Basic BI
Read this report from Aberdeen Research to learn why the best-in-class companies are looking to leverage AI-infused BI.
Why We’re a Top-Ranked BI Solution
See why IBM has been named a market leader in the recent BARC Score Business Intelligence report.
Download PDF
Download the PDF version of this white paper.