The RPM Portfolio Dashboard allows you to generate four types of reports. Use the graphics on this page to see guidelines that can help you to choose the report type that best fits your situation.

Predefined Reports
Use the predefined reports when it is important to have consistent reporting. The predefined reports are controlled by the RPM administrator, so individual RPM users cannot modify the format. Predefined reports are useful for regular status meetings where project-to-project consistency is required.OnLine Analytical Processing (OLAP) Pivots
Use OLAP Pivots when you need to explore and organize numeric project data in ways that are not available in the predefined reports. The OLAP Pivot enables you to quickly assemble columns of project data and then group the data in nearly infinite ways.Investment Map
Use Investment Maps to create graphs that show how projects compare with one another. These charts can include up to four dimensions of information in a single chart. The four dimensions might be very different kinds of information, such as project health, cost, revenue, or number of defects.Scorecard Map
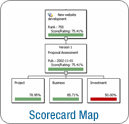
Use Scorecard Maps to summarize the project scorecard health assessments. They summarize the subjective aspects of project status.


