This section provides information on how to complete the most common tasks associated with QueryMonitor. Go to the section that describes the task that you want to perform:
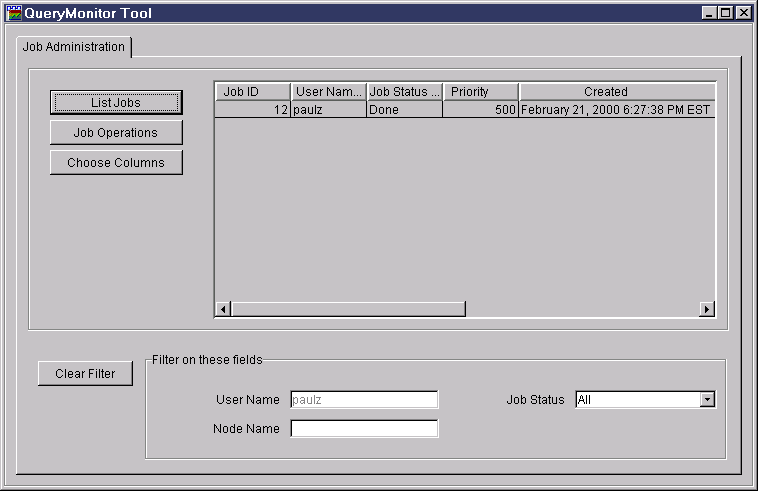
When you start QueryMonitor, the QueryMonitor's main window opens, as shown in Starting and Stopping QueryMonitor. By default, no jobs are displayed in the QueryMonitor's main window.
To display a list of jobs that your user account has submitted, click on
List Jobs. The QueryMonitor window will list all of the jobs
submitted by the user account that you used to log on to QuerMonitor.
For example:

If you are a user with administrative or operator privileges, clicking on
List Jobs will return a list of jobs submitted by all users.
For example:
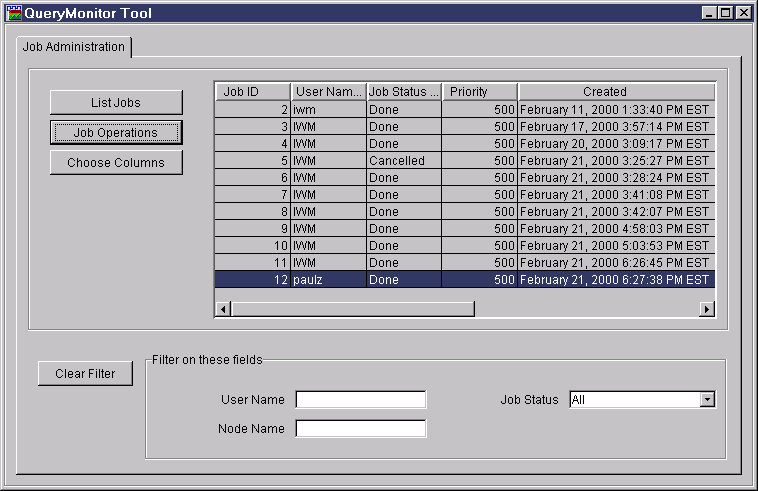
You can use the filtering criteria in the Filter on these fields box to filter the jobs that are displayed in the QueryMonitor's main window. For example, you can display jobs with a status of Done, jobs that reside on a particular node, or a combination of the two.
You cannot obtain a job listing for user accounts other than your own, unless you are logged on to QueryMonitor as a user with administrative or operator privileges. If you are logged on as a user with either of these privileges, you can also specify the username as an additional filtering criteria.
To specify which jobs to display in QueryMonitor's main window, you must define a filtering criteria and then click on List Jobs or press the Enter key. The jobs listed will only be those that match the criteria that you defined in the Filter on these fields box.
| Note: | Whenever you change the Job Status field, the job list automatically redisplays. You do not need to click on List Jobs or press the Enter key to update the QueryMonitor's main window. |
Any combination of the following criteria can be used to filter the list of jobs displayed in the QueryMonitor's main window:
To reset the QueryMonitor's main window, click on Clear Filter. This option will clear the User Name and Node Name fields, and set Job Status to ALL.
You can customize the columns that appear in the QueryMonitor window to track specific information. A default list of the characteristics that describe each job is shown each time you start QueryMonitor. The customized columns that you select are added for the duration of the current session only. When you close and start QueryMonitor again, the columns displayed will return to the default list.
To customize the columns that appear in QueryMonitor, click on Choose
Columns. The Select Columns for Display window opens:
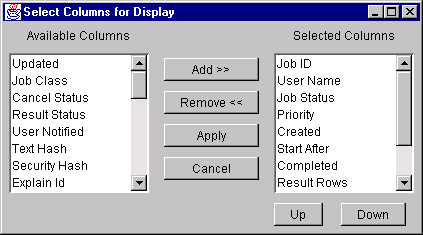
You can add or remove any of the columns shown in the Available
Columns box to the QueryMonitor's main window.
To add a column, perform the following steps:
Step 1. | Select the column to be added from the Available Columns box. | ||
Step 2. | Click on Add >>. The selected column is moved to the bottom of the Selected Columns box. | ||
Step 3. | Select the column that you just added from the Selected Columns box and click on Up or Down to change the order of the column.
| ||
Step 4. | Click on Apply. The QueryMonitor's main window is updated. If you do not want these changes to take effect, click on Cancel.
|
To remove a column, perform the following steps:
Step 1. | Select the column to be removed from the Selected Columns box. |
Step 2. | Click on Remove <<. The selected column will be moved to the bottom of the Available Columns box. |
Step 3. | Click on Apply. The QueryMonitor's main window is updated. If you do not want these changes to take effect, click on Cancel.
|
You can reorder any column in ascending or descending order by clicking on the column's heading. The order of a column is changed for the duration of the current session only. When you close and start QueryMonitor again, all columns will return to the default order.
The first time you click on a column's heading, the order of the column is changed to descending order. Clicking on the same column heading will reorder the column in ascending order.
You can resize any column that appears in the QueryMonitor's main window. The width of a column is changed for the duration of the current session only. When you close and start QueryMonitor again, the width of the columns will return to the default size.
To resize a column, perform the following steps:
Step 1. | Move the mouse pointer to the vertical line forming the right edge of the
column that you want to resize. The mouse pointer changes to a double
arrow. For example:
|
Step 2. | Click and hold the mouse button on the vertical line and resize the column. Release the mouse button when the column is resized to the desired width.
|
You must refresh the QueryMonitor's main window to retrieve the most current information from the DB2 Query Patroller Server. Some operations such as changing the job status filter criteria, or submitting a new job, automatically refresh this window for you.
To manually refresh the QueryMonitor's main window, click on List Jobs.
From the QueryMonitor's main window, you can select a specific job and drill down to view detailed information about that job. To view specific details about a job, perform the following steps:
Step 1. | Select the job whose details you want to view. You can select more than one job by pressing and holding the Ctrl key. | ||
Step 2. | Click on Job Operations. | ||
Step 3. | Select the Job Detail option from the pop-up menu. A Detailed Information for Job window opens. For example:
|
To refresh a Detailed Information for Job window with the most current information, select File->Refresh from the action menu bar.
To close a Detailed Information for Job window, select File->Close from the action menu bar.
Table 4 contains a description for each field at the top of a
Detailed Information for Job window.
Table 4. Fields Above the Tabs in the Detailed Information for Job Window
| Field | Description |
|---|---|
| Job ID | Contains the ID of the job that was submitted. |
| User Name | Contains the username of the user that submitted the job. |
| Job Status | Contains the job's status. |
| Job Class | Contains the classification of the job. A job can be classified as a Database job or as an OS (operating system) job. |
| Result Status | Contains the result status of the job. The result status can be
classified as:
|
| Cancel Status |
Indicates the status of any cancellation requested for this job. The cancellation status can be classified as:
|
To view result information, select the Result Information
tab on a Detailed Information for Job window. The Result Information
page displays result-related information with respect to the selected
job. The Result Information page is shown below:
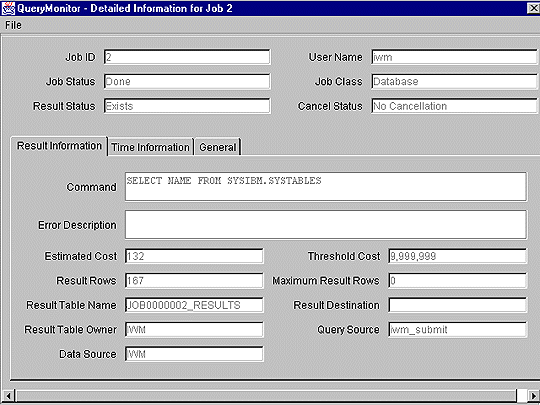
Table 5 contains a description of each field on the Result
Information page.
Table 5. Fields on the Result Information Page
| Field | Description |
|---|---|
| Command | Contains the command or query that is associated with the job. |
| Error Description | If the job was placed in a Held or Aborted state, this field will give a description of the error that was received. If the job was placed in a Queued state, this field will give a reason why. |
| Estimated Cost | Indicates the estimated database cost of the job. |
| Threshold Cost | Indicates the user's threshold cost of the job. |
| Result Rows | Indicates the number of rows returned in the result set for the job. |
| Maximum Result Rows | Indicates the user's threshold for the maximum number of rows in a result set allowed for this job. |
| Result Table Name | Contains the name of the result table. |
| Result Destination | Contains the name of the alternate result destination, if defined. |
| Result Table Owner | Contains the username of the result table owner. |
| Query Source | Indicates the application that created the job. |
| Data Source | Indicates the database against which the query was run. |
To view time information, select the Time Information tab on
a Detailed Information for Job window. The Time Information page
displays time-related information with respect to the selected job. The
Time Information page is shown below:
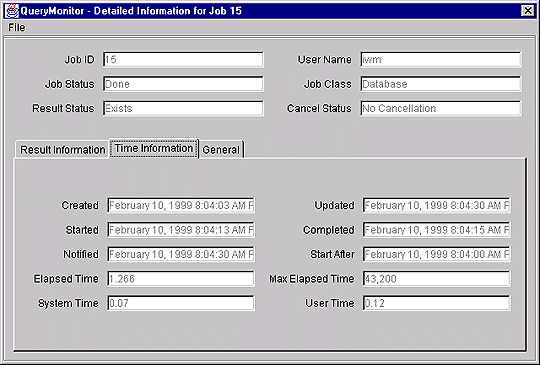
Table 6 contains a description of each field on the Time Information
page.
Table 6. Fields on the Time Information Page
| Field | Description |
|---|---|
| Created | Indicates the date and time the job was created. |
| Updated | If the job has been updated, this field indicates the date and time the job was updated. |
| Started | Indicates the date and time the job was started, if applicable. |
| Completed | Indicates the date and time the job completed, if applicable. |
| Notified | Indicates the date and time a user notification of job completion was sent, if applicable. |
| Start After | Indicates the date and time after which the job can be scheduled for to run. |
| Elapsed Time | Displays the number of seconds it took for the job to run. |
| Maximum Elapsed Time | Indicates the maximum number of seconds allowed for the job to run. |
| System Time | Indicates the system CPU time, in seconds, that were used to run this job. |
| User Time | Indicates the user CPU time, in seconds, that were used to run this job. |
To view general information, select the General tab on a
Detailed Information for Job window. The General page displays general
information with respect to the selected job. The General page is shown
below:
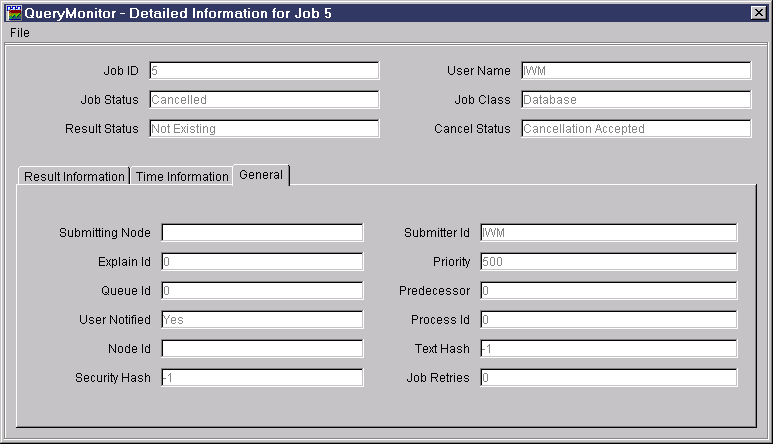
Table 7 contains a description of each field on the General
page.
Table 7. Fields on the General Page
| Field | Description |
|---|---|
| Submitting Node | Contains the hostname of the database partition server where the job was submitted. In a non-partitioned database environment, this will always be the hostname of the workstation where the query was submitted. |
| Submitter ID | Contains the username of the user who submitted the job. |
| Explain ID | Contains the ID of the job in the Explain cache. |
| Priority | Displays the priority level for the job. |
| Queue ID | Indicates the job queue ID. |
| Predecessor | Identifies which job must successfully complete before this job can be scheduled to run. |
| User Notified | Indicates whether or not the user was notified when the job completed. |
| Process ID | Contains the process ID of the run component. |
| Node ID | Contains the hostname of the database partition server where the job was run. In a non-partitioned database environment, this will always be the hostname of the DB2 Query Patroller Server. |
| Text Hash | Contains a hash value used to limit the number of rows scanned to find a specific SQL statement. |
| Security Hash | Contains the hash value used to ensure that job data is not modified. |
| Job Retires | The number of times DB2 Query Patroller will retry the job if it times out. |
Typically, you will use an application to submit queries. The query is then trapped by QueryEnabler and passed to the DB2 Query Patroller Server. You can use QueryMonitor to submit simple queries that are directly routed to the DB2 Query Patroller Server. This method bypasses QueryEnabler and therefore you will not have the option to view the result set of your query. However, the result set is updated in the DB2 Query Patroller Server's database.
To submit a new job from QueryMonitor, perform the following steps:
Step 1. | Click on Job Operations. |
Step 2. | Select New Job from the pop-up menu. The Job Operations window opens:
|
Step 3. | Click on the Enter New Query box and enter a query. For example, enter the following query: select * from paulz.department |
Step 4. | Click on OK. The job list is automatically refreshed and displays the new job.
|
You can use the QueryMonitor to resubmit a job that has already completed. To resubmit a job, perform the following steps:
Step 1. | Select the job you want to resubmit. The selected job must have a status of Done. You can select more than one job to resubmit by pressing and holding the Ctrl key. |
Step 2. | Click on Job Operations. |
Step 3. | Select Resubmit Job from the pop-up menu. A pop-up window opens asking you to confirm that you want to resubmit the selected job. |
Step 4. | Click on Yes to resubmit the job, or click on No to cancel the resubmission request.
|
You can use QueryMonitor to modify the status of a job. If you are not logged on to QueryEnabler as a user with administrative or operator privileges, you can only cancel a job.
To modify the status of a job, perform the following steps:
Step 1. | Select the job that you want to modify. The selected job must have a status of Estimating, Hold, Queued, or Scheduled. You can modify the status of more than one job by pressing and holding the Ctrl key. |
Step 2. | Click on Job Operations. |
Step 3. | Select Modify Status from the pop-up menu. The Job
Operation window opens, for example:
|
Step 4. | Click on the drop down box and select either Cancel, Queue, or Scheduled. |
Step 5. | Click on Yes to change the job status, or click on No to cancel. The Query Monitor's main window will automatically refresh.
|
If you are finished viewing a result set, you can drop the result set to free space in the database. To drop a result set, perform the following steps:
Step 1. | Select the job for which you want to drop the result set. The selected job must have a status of Done. You can drop the result set for more than one job by pressing and holding the Ctrl key. |
Step 2. | Click on Job Operations. |
Step 3. | Select Drop Result Set from the pop-up menu. A pop-up window opens asking you to confirm the result set that you have selected to drop. |
Step 4. | Click on Yes to drop the selected result set or click on No to cancel the drop request.
|