Quick Beginnings for Linux**
You can administer local or remote servers using the DB2
Administration Tools. Use the Control Center to perform administration
tasks such as configuring DB2 instances and databases, backing up and
recovering data, scheduling jobs, and managing media, all from a graphical
interface.
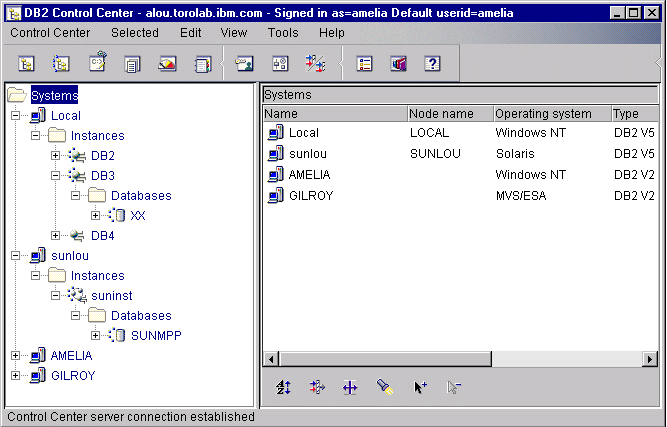
The Control Center displays instances and database objects
(such as table spaces, tables, and packages) and their relationships to each
other. Using the Control Center, you can manage local and remote
servers from a single point of control. See Figure 2 for an example of the main Control Center window.
Figure 2. Control Center Main Window
The Control Center distinguishes between single-partition and
multi-partiton database systems via Discovery. Discovery
uses the DB2SYSTEM, DB2ADMINSEVER and DB2COMM
registry values. For more information on these registry values, refer
to the Administration Guide.
From the Control Center, you can perform operations on database
objects. These operations include:
- Create and drop a database
- Create, alter, and drop a table space or table
- Create, alter, and drop an index
- Backup and recover a database or tablespace
- Define the replication sources and subscriptions to replicate data between
systems
- Monitor resources and events on a server.
You can also control DB2 instances by:
- Maintaining communication protocols
- Setting database manager and database configuration values that affect
performance.
Wizards are provided to help you perform complex tasks. For example,
a wizard is available to tune the performance of your system. See Using DB2 Wizards for descriptions of the various wizards and how to start
them.
The Control Center provides additional functionality to assist you in
managing your servers:
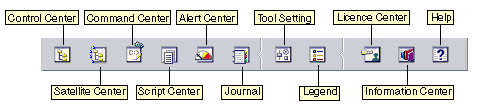
- Control Center
- Use the Control Center to start another session of the Control Center to
administer a server.
- Satellite Center
- Use the Satellite Center to manage the Satellites that are served by a
particular DB2 Control Server. It provides create, remove, modify, and
manage functions for Satellites and Groups. You can also create and
manage scripts to administer the Satellites.
- Data Warehouse Center
- Use the Data Warehouse Center to manage warehouses; create and manage
warehouse objects, such as sources and targets; define, extract,
transform, manipulate, and load steps and processes; and schedule and
automate steps.
- Command Center
- Use the Command Center to enter DB2 commands and SQL statements in an
interactive window and see the execution result in a result window. You
can scroll through the results and save the output to a file.
- Script Center
- Use the Script Center to create scripts, which you can store and invoke at
a later time. These scripts can contain DB2 commands, SQL statements,
as well as operating system commands. Scripts can be scheduled to run
unattended. These jobs can be run once or set up to run on a repeating
schedule; a repeating schedule is particularly useful for tasks like
backup.
- Alert Center
- Use the Alert Center to monitor your system for early warnings of
potential problems or to automate actions to correct problems
discovered.
- Journal
- Use the Journal to view all available information about jobs that are
pending execution, executing, or that have completed execution. You can
also view the recovery history log, the alerts log, and the messages log;
and review the results of jobs that are run unattended.
- License Center
- Use the License Center to manage licenses and display license status and
usage of any DB2 products installed on your system. You can also use
the License Center to configure your system for proper license
monitoring.
- Stored Procedure Builder
- Use Stored Procedure Builder to create stored procedures on local and
remote DB2 servers, modify and rebuild existing stored procedures, and run
stored procedures for testing and debugging the execution of installed stored
procedures.
- Tools Setting
- Use the Tools Setting to change the settings for the DB2 Administration
Tools.
- Information Center
- The Information Center provides quick access to DB2 product
information. This product information includes such items as:
database tasks, reference material, DB2 documentation, warehouse
administration information, troubleshooting aids, sample programs for
application development, and DB2 web-related URLs.
You can also analyze performance using the DB2 Performance Monitor and
Visual Explain. These tools are available from the Control
Center.

| Use the DB2 Performance Monitor to monitor the performance of
your system. You can monitor activity by sampling data over a period of
time or using data for a particular event. See "Monitoring Databases using DB2 Performance Monitor" for more information.
|

| Use Visual Explain to view the access plan for explained SQL
statements as a graph. You can use the information available from the
graph to tune your SQL queries for better performance. See "Viewing SQL Access Plans using Visual Explain" for more information.
|
You can find additional information in the Administration Guide or in the online help.
The Control Center allows you to view, update, and reset
server protocol settings. These functions are accessed by clicking with
the right mouse button on an instance and selecting the Setup
communications option from the pop-up menu. This tool helps
database administrators to:
- Configure database manager parameters by clicking with the right mouse
button on an instance and selecting the Configure option from the
pop-up menu. By default, the setup program automatically detects and
configures most communication protocols that it detects on your system.
- Export database information in a profile that can be used to configure
clients by clicking with the right mouse button on a system and selecting the
Export Server Profile option from the pop-up menu.

| DB2 Personal Edition does not accept inbound client requests for
data. You can only configure inbound communications on a DB2 Personal
Edition workstation to allow administrative requests from a DB2 Administration
Client.
|
For information on how to configure server communications, refer to the
Installation and Configuration Supplement.
With the DB2 Performance Monitor, you can:
- Identify and analyze performance problems in database applications or the
database manager.
- Use the early warning system to detect potential problems.
- Automate actions to correct problems that are discovered.
- Define your own statistics, in addition to the default set that is
provided.
You can choose to monitor the current state of database activity or collect
information when specific events occur. The Performance Monitor allows
you to capture point-in-time information at specified intervals. The
Event Analyzer allows you to view information about the occurrence of events
such as deadlocks and transaction completions.
For additional information, refer to the Administration
Guide or the online help. You are also able to use the Windows Performance
Monitor (supported on Windows NT and Windows 2000) to monitor both database
and system performance. For information on how to register DB2
resources and to use the Windows Performance Monitor, refer to the Administration Guide.
Visual Explain helps database administrators and
application developers to:
- View the access plan chosen by the database manager's optimizer for a
given SQL statement.
- Tune SQL statements for better performance.
- Design application programs and databases.
- View all the details of an access plan, including the statistics in the
system catalogs.
- Decide whether or not to add an index to a table.
- Identify the source of problems by analyzing the access plan or
performance of SQL statements.
- Use the portable snapshot function to view snapshots from any remote DB2
server.
- Display access plans for queries on all supported DB2
configurations.
For additional information, refer to the Administration
Guide or the online help.
[ Top of Page | Previous Page | Next Page ]