
You can administer local or remote servers using the DB2 Administration Tools. Use the Control Center to perform administration tasks such as configuring DB2 instances and databases, backing up and recovering data, scheduling jobs, and managing media, all from a graphical interface.
In a partitioned database system, you must also have a listener daemon that runs on each machine in the instance. This daemon is called db2cclst, and is used by all instances that are on the machine. The Control Center uses the listener daemon to retrieve status, connection, and snapshot information from each database partition server. The daemon is not associated with a specific instance; rather, it functions as a global server for the machine.
The listener daemon requires a predefined named port. The named port must be called db2ccmsrv and must be defined in the /etc/services file on every machine. The named port can be assigned any unused port number, but the same number must be used for all machines.
The Control Center for Version 6 has additional support for DB2 UDB for OS/390.
| Note: | This option is only available on DB2 Enterprise Edition, DB2 Enterprise - Extended Edition, DB2 Connect Personal Edition, and DB2 Connect Enterprise Edition. |
If you want to access DB2 for OS/390 functions from the Control Center:
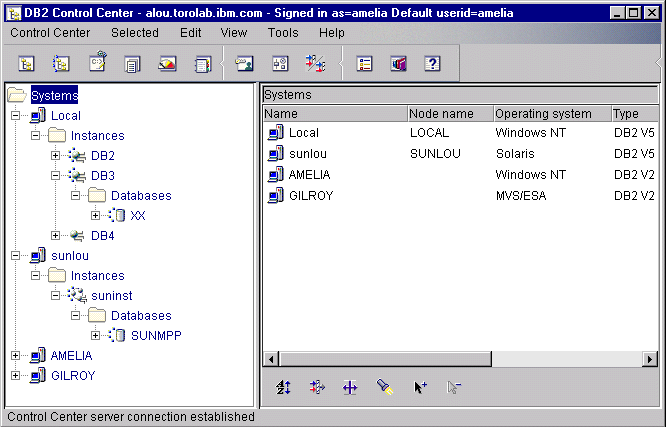
The Control Center displays instances and database objects (such as table spaces, tables, and packages) and their relationships to each other. Using the Control Center, you can manage local and remote servers from a single point of control. See Figure 9 for an example of the main Control Center window.
Figure 9. Control Center Main Window
 |
The Control Center distinguishes between single-partition and multipartition database systems via Discovery. Discovery uses the DB2SYSTEM, DB2ADMINSERVER, and DB2COMM registry values. For more information on these registry values, refer to the Administration Guide.
From the Control Center, you can perform operations on database objects. These operations include:
For more information on objects in a partitioned database system, see Introduction to DB2 Enterprise - Extended Edition.
You can also control DB2 instances by:
SmartGuides are provided to help you perform complex tasks. For example, a SmartGuide is available to tune the performance of your system. See Completing Tasks with SmartGuides for descriptions of the various SmartGuides and how to start them.
The Control Center provides additional functionality to assist you in
managing your servers:

You can also analyze performance using the DB2 Performance Monitor and
Visual Explain. These tools are available from the Control
Center.
|
| Use the DB2 Performance Monitor to monitor the performance of your system. You can monitor activity by sampling data over a period of time or using data for a particular event. See "Monitoring Databases Using DB2 Performance Monitor" for more information. |
 | Use Visual Explain to view the access plan for explained SQL statements as a graph. You can use the information available from the graph to tune your SQL queries for better performance. See "Viewing SQL Access Plans Using Visual Explain" for more information. |
You can find additional information in the Administration Guide or in the online help.
The Control Center allows you to maintain or edit server protocol settings in the database manager configuration file.
 | By default, the setup program automatically detects and configures most communication protocols that it detects on your system. |
 | DB2 Personal Edition does not accept inbound client requests for data. You can only configure inbound communications on a DB2 Personal Edition workstation to allow administrative requests from a DB2 Administration Client. |
For information on how to configure server communications, refer to the Installation and Configuration Supplement.
With the DB2 Performance Monitor, you can:
You can choose to monitor the current state of database activity or collect information when specific events occur. The Performance Monitor allows you to capture point-in-time information at specified intervals. The Event Analyzer allows you to view information about the occurrence of events such as deadlocks and transaction completions.
For additional information, refer to the Administration Guide or the online help.
Visual Explain helps database administrators and application developers to:
For additional information, refer to the Administration Guide or the online help.