 This example uses the access plan created for a basic
query with no indexes and no statistics. Answers to some vital
questions will help you understand how to improve the query. You can follow along interactively using the sample snapshots
provided.
This example uses the access plan created for a basic
query with no indexes and no statistics. Answers to some vital
questions will help you understand how to improve the query. You can follow along interactively using the sample snapshots
provided.
This example uses the access plan created for a basic
query with no indexes and no statistics. Answers to some vital
questions will help you understand how to improve the query. You can follow along interactively using the sample snapshots
provided.
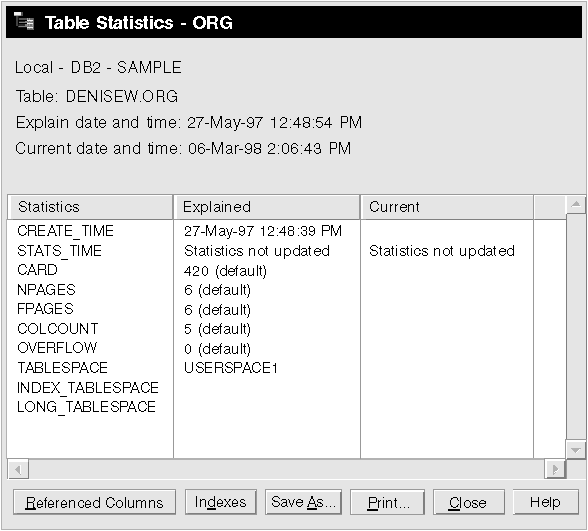
1. Do current statistics exist for each table in the query?
To check if current statistics exist for each table in the query, double-click on each table node in the access plan graph. On the corresponding Table Statistics window that opens, the STATS_TIME row under the Explained column contains the words "Statistics not updated" if no statistics had been collected at the time when the snapshot was created.
If current statistics do not exist, the optimizer uses default statistics, which may differ from the actual statistics. Default statistics are identified by the word "default" under the Explained column in the Table Statistics window.
According to the information in the Table Statistics window for the ORG table, the optimizer used default statistics (as indicated next to the explained values). Default statistics were used because actual statistics were not available when the snapshot was created (as indicated in the STATS_TIME row).
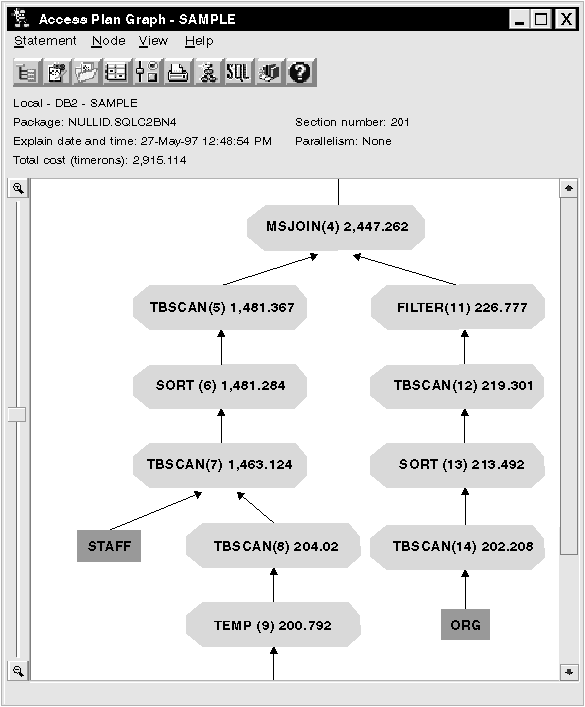
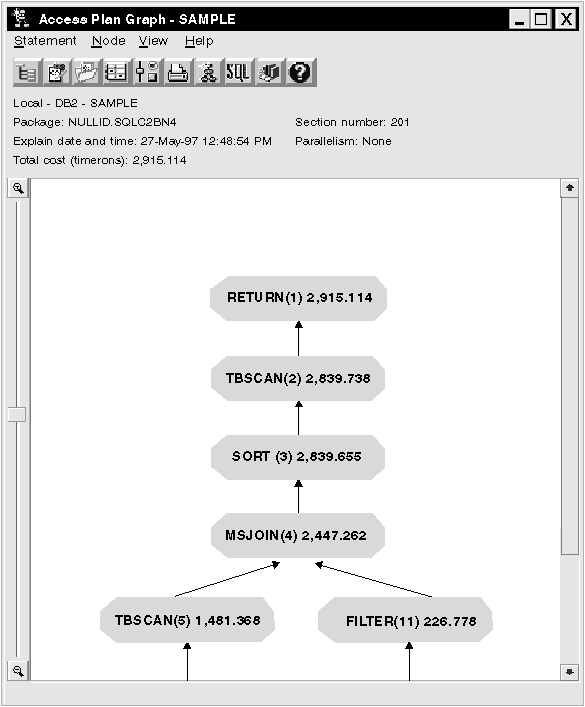
2. Does this access plan use the most effective methods of accessing data?
This access plan contains table scans, not index scans. Table scans are shown as an octagon and labeled TBSCAN. Index scans, which are shown as diamonds and labeled IXSCAN, use an index that was created for a table and are more cost-effective than table scans if small amounts of data are being extracted.
3. How effective is this access plan?
You can determine the effectiveness of an access plan only if it is based on actual statistics. Since the optimizer used default statistics in the access plan, you cannot determine how effective the plan is.
In general, you should make a note of the total estimated cost for the access plan for later comparison with revised access plans. The cost listed in each node is cumulative, from the first steps of your query up to and including the node.
In the Access Plan Graph window, the total cost is approximately 2,915 timerons, shown in RETURN (1) at the top of the graph. The total estimated cost is also shown in the top area of the window.
How to further refine this access plan
Use the runstats command to provide the optimizer with current statistics on all tables accessed by the query.
The next example looks at an access plan for the basic query after runstats has been run.