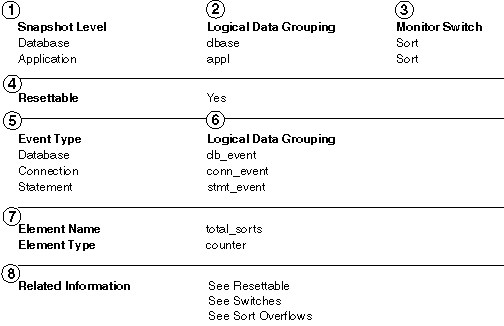

The section for each data element begins with a table that lists standard information. An example is shown in Figure 3, followed by an explanation of each part of the table.
Figure 3. Sample Element Table
 |
This table is followed by a description of the element and information on how you can use it when monitoring your database.
Data elements are classified by the following categories:
A counter counts the number of times an activity occurs. Counter values increase during monitoring. Most are resettable.
A gauge indicates the current value for an item. This value can go up and down depending on database activity (for example, the number of locks held).
A water mark indicates the highest (maximum) or lowest (minimum) value an element reached since monitoring was started. These are not resettable.
An information element provides reference-type details of your monitoring activities. This can include items such as node names, aliases, and path details.
A timestamp indicates the date and time that an activity took place, by providing the number of seconds and microseconds that have elapsed since January 1, 1970. In the C language, for example, this can be converted to calendar date and time using the ctime() function.
Time returns the number of seconds and microseconds spent on an activity.