
The database system monitor interface is the same for all types of systems, whether they use single partition or multiple partition databases and whether intra-query parallelism is used. All the commands and APIs are exactly the same. The only difference is the output; more complex systems generally return more information.
On systems that use inter-partition parallelism, taking a snapshot only returns monitor data from the instance where the application is attached. For example, assuming a table that is located in two database partitions, that is some of its rows are stored on one node (Node 100) and others are stored on another node (Node 200).
 |
Taking a snapshot on Node 200 initially returns no data:
| Note: | The LIST APPLICATION command uses the database system monitor. Invoking it actually calls the the snapshot API db2GetSnapshot() with a request of type SQLMA_APPLINFO_ALL. |
 |
Now, issuing a query from Node 100 will result in a secondary connection to Node 200 to fetch the rows that reside in that partition:
 |
Now there is a subagent for the application running on Node 200:
 |
And there are now two agents running on Node 100; the coordinator agent and a subagent:
 |
On the non-coordinating node, you can determine where the coordinator resides, and check if the application originated on the node that issued the snapshot, using:
 |
The Application Handle returned, 6553638 is unique across all nodes. The node number corresponds to one of the nodes listed in the db2nodes.cfg configuration file (see the Administration Guide).
Using the application handle, you can request monitor information on any node by issuing a GET SNAPSHOT FOR APPLICATION, which will return data if the application is connected on that node. You can also FORCE the application, which will work from any node:
 |
An event monitor uses an operating system process or a thread to write its trace. The node where this process or thread runs is called the monitor node. An event monitor can be monitoring events as they occur locally on the monitor node, or globally as they occur on any node where the DB2 database manager is running. A global event monitor writes a single trace that contains activity from all nodes.
Whether an event monitor is local or global is referred to as its monitoring scope. Both the monitor node and monitor scope are part of an event monitor's definition. For example:
 |
This global event monitor will report deadlocks that involve any nodes in the system. Its I/O component will physically run on Node 5, writing its records to files in the /tmp/dlocks directory on that node.
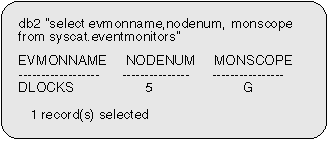
You can look at the definition for this monitor in the system catalog:
 |
The returned information shows event monitor DLOCKS is defined as global and its monitor node is 5.
| Note: | Only deadlock event monitors can be defined as global, all other event monitors must be defined as local. |
On systems that use inter-partition parallelism, the SQL compiler partitions the access plan for an SQL statement into subsections. Each subsection is executed by a different DB2 agent.
The access plan for an SQL statement generated by the DB2 code generator during compilation can be obtained using the db2expln or dynexpln commands (see the Command Reference). As an example, selecting all the rows from a table that is partitioned across several nodes might result in an access plan having two subsections:
In this simple example, subsection 1 would be distributed across all the database partitions. There would be a subagent executing this subsection on each physical node of the nodegroup to which this table belongs. See Administration Guide for more information on these concepts.
The database system monitor allows you to correlate run-time information with the access plan, which is compile-time information. With inter-partition parallelism, it breaks information down to the subsection level. For example, when the statement monitor switch is ON, a GET SNAPSHOT FOR APPLICATION will return information for each subsection executing on this node, as well as totals for the statement.
The subsection information returned for an application snapshot includes:
The information logged by a statement event monitor for each subsection after it has finished executing includes: CPU consumption, total execution, time, and several other counters.