
The Tracker query utility allows you to display database usage history information through predefined reports. These reports provide you with job history information from DB2 Query Patroller if DB2 Query Patroller has been set up to collect job accounting information.
When you enter the Tracker application, you choose an initial report for Tracker to display. You can choose to display the following reports:
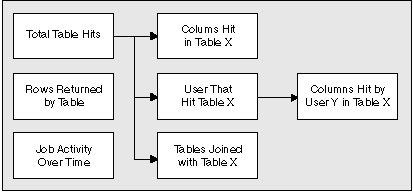
After a report displays, you can drill down to display more specific
information if additional reports are available. The reports and drill
paths you can choose are shown in the following diagram:

The Total Table Hits report and the Rows Hit by Table report display count or percentage information that can be formatted as bar charts, lists, or pie charts. As you drill down through subsequent reports, each report displays in the same format (bar chart, pie chart, or list), until you change the current report format. The Job Activity over Time report displays time information and a list of completed jobs. It can only be displayed as a time chart.
When you display data as a count, the data is an integer. For example, when calculating the tables hit, Tracker counts the number of times each table is accessed.
When you display data as a percentage, the data displayed is a percentage of the total count for all the elements that have been accessed. If a similar element is not accessed, it is not included in the percentage calculation. For example, when calculating the percentage for table hits, Tracker counts all the hits for all tables. The percentage for a particular table is the number of hits for that table divided by the total number of hits multiplied by 100%.